
This paper describes the procedures implemented in Palmachim SWRO desalination plant (Israel, 2007). It may serve as a template in preparing the desalination plant RFP - request for proposal. It touches the main points to be explained by the project bidder in her/his technical offer.
Poorly controllable startups and shutdowns may impair the mechanical integrity and performance of the reverse osmosis membranes. To mitigate these problems, the RO membranes manufacturers set limit on the feed pressure variation at the RO membrane inlet to 0.7 Bar/sec. Practical implementation of this requirement depends upon the energy recovery method. This paper describes selection of the startup and shutdown procedures for the high pressure feed pump coupled to the Pelton turbine. These procedures have been implemented in the Palmachim SWRO desalination plant (2007, Israel).
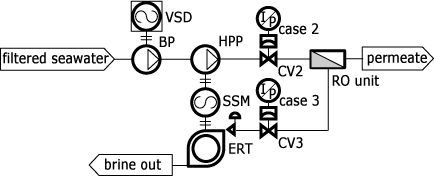
Fig.1 High pressure pumping train principal flow diagram BP – booster pump, VSD – variable speed drive, HPP – high-pressure pump, SSM – AC motor with soft starter, ERT – energy-recovery turbine, CV2, CV3 – valves pneumatically actuated
The high-pressure train in question consists of a booster pump (BP) equipped with a variable-speed driver (VSD), a high-pressure pump (HPP) driven by an asynchronous electric motor with soft starter (SSM), and an energy recovery turbine (ERT). BP and HPP increase the feed water pressure to that required by the reverse osmosis. The pressure energy of the brine rejected by the RO membranes is recovered in ERT, SSM providing the net surplus power (Fig.1).
The high pressure pumping train (HPPT) differs from the conventional scheme having the control valve installed after HPP and not equipped with the soft starter. In the latter scheme, BP and HPP start simultaneously against the closed control valve CV2. After the design pressure is reached, the control valve is gradually opened.
The known drawbacks of this scheme are as follows.
- The cost of the control valve assembly is high as it should be sized to withstand severe cavitation (applications of valves undersized and not suitable for cavitation service are a case). Noise, mechanical vibration, and erosion of the valve trim components are the companions of cavitation.
- The pressure rise control within the cavitation region is unreliable, the only recourse being longer valve opening times selected by trial and error.
- The valve hydraulic resistance adds to electricity costs.
- Due to throttling at startup the motor should be oversized by 15 – 20% which increases the initial costs and electricity consumption in most cases.
- Shutdown is not controllable.
- Any trips in a second pass of the reverse osmosis unit or in a post-treatment system inevitably lead to the HPPT complete shutdown. Recovery from such trips may take hours and leads to revenue losses.
Introduction of the soft starter makes the control valve application unnecessary. The soft starter is a single, easy-to-wire, high-performance and reliable device utilizing thyristors in a full-wave power bridge configuration. By varying the thyristor conduction period, the starter controls the voltage applied to the motor. This, in turn, controls the torque developed by the motor. After the motor reaches its designed speed, contacts are closed to bypass the thyristors.
A soft starter provides the following standard options: start with boost (kick start), voltage/current ramp start, current limiting start and voltage ramp stop. The kick start can be used when the pump starting friction torque is high. The ramp start allows for gradual increase in the motor torque with its rotation speed. With current limiting starting, the user programs the maximum current applied to the motor during the ramp period. With a soft starter mechanical components can have longer life and/or be reduced in size because of lower starting toque values. As soft starters reduce stress on a system by eliminating the jolts and violent speed variations that the DOL starters introduce to a process, fewer mechanical breakdowns occur that extends the life of the components. The soft starters reduce stress on electrical supply, helping to meet utility requirements for power-voltage starting and eliminating voltage dips and brown-out conditions. Depending on the voltage, the installed costs of soft starters are 15…30% of the motor costs.
The start/stop procedures have been emulated with the numeric model written in Java and utilizing the following sources of information.
- Pump actual performance curves describing the total differential head (TDH), hydraulic efficiency and the net positive suction head as functions of mass flow rate (Figs 15,16)
- Pump startup torque as a function of its rotation speed
- ERT “hill” chart (Fig.14)
- AC motor electric current and torque as functions of its rotation speed (Fig.12)
- AC motor overload time against the electric current (Fig.13)
- Interconnecting piping geometry and hydraulic resistance (Table 3, Fig.17)
- Reverse osmosis membrane model replicating the DOW seawater membranes
- Valves and their assemblies’ characteristics
- Rotating equipment moments of inertia
The water hammer effect is neglected as the closure times for valves CV2 and CV3 (3…6 second) are much higher than the time required for the pressure wave propagation from the valves to membranes (10 – 100 milliseconds).
The said model is realized as general-purpose software package intended for rating calculations, the part-load and transient performance analysis, and the control modeling and optimization. As for the plant design, the package is of limited use as it primarily serves to point-match the actual pieces of equipment: pumps, turbines, motors, membranes, and piping.
The table 1 contains the sample printout data for the plant summer operation with clean membranes. The startup for these unfavorable conditions is the most difficult as ERT receives minimum water flow.
Table 1 HPPT performance prediction (clean membrane case)| Category | Unit | Value |
|---|---|---|
| BP make | 10LPN27(Flowserve) | |
| BP suction pressure | kPa | 95 |
| BP rotation speed | rpm | 1389 |
| BP flow rate | kg/s | 437.35 |
| BP TDH | m | 129.79891 |
| BP net positive suction head required | m | 4.28129 |
| BP efficiency | 0.8438 | |
| BP absorbed power | kW | 659.94 |
| BP torque | Nm | 4536 |
| BP AC motor size | kW | 900 |
| BP VFD load | kW | 680.46 |
| BP pressure drop in piping | m | 13.18343 |
| HPP make | 10x16DMX3(Flowserve) | |
| HPP suction pressure | m | 125.97656 |
| HPP rotation speed | rpm | 2980 |
| HPP flow rate | kg/s | 437.35 |
| HPP TDH | m | 497.30494 |
| HPP piping pressure drop | m | 3.07485 |
| HPP efficiency | 0.8599 | |
| HPP torque | Nm | 7951 |
| HPP absorbed power | kW | 2481.38 |
| HPP net power | kW | 1311.9 |
| HPP AC motor size | kW | 1400 |
| HPP AC motor consumption | kW | 1351.68 |
| ERT control mode | pressure following | |
| ERT hydraulic efficiency | 0.8824 | |
| ERT overall efficiency | 0.8692 | |
| ERT flow rate | kg/s | 234.87 |
| ERT piping pressure loss | m | 1.46763 |
| ERT total static head | m | 584.15634 |
| ERT shaft power output | kW | 1169.48 |
| RO membrane reference type | SW30HRLE380 | |
| RO vessel number | 190 | |
| RO membrane number | 8 | |
| RO membrane fouling | 0.95 | |
| RO membranes feed flow rate | kg/s | 437.35 |
| RO membranes feed temperature | oC | 31.31 |
| RO membranes feed pressure | kPa | 6227.5527 |
| RO membranes feed salinity | kg/kg | 0.039 |
| RO membranes feed density | kg/m3 | 1023.9118 |
| RO membranes recovery | 0.474 | |
| RO lead membrane maximum flux | kg/sq.m*h | 33.33 |
| RO membranes front-to-all permeate ratio | 0.35 | |
| RO membranes head permeate salinity | kg/kg | 0.00019 |
| RO membranes head permeate flow rate | kg/s | 70.87 |
| RO membranes rear permeate salinity | kg/kg | 0.00041 |
| RO membranes rear permeate flow rate | kg/s | 131.61 |
| RO membranes brine pressure | kPa | 6039.8457 |
| RO membranes brine flow rate | kg/s | 234.88 |
| RO membranes brine salinity | kg/kg | 0.07233 |
| RO membranes brine density | kg/m3 | 1049.0633 |
| BP and HPP pumps power consumption | kW | 2046.02 |

Fig.2 Startup diagram: (O-A) – booster operation region, (A-B) – HPP and ERT free rollup; (B-C) – motor soft start
The proposed basic soft startup procedure includes 3 steps (Fig.2).
- BP is rolled up to the discharge pressure of 12 Bara at the rate of 1.0 Bar/sec. When the discharge pressure reaches 9.0-11.0 the equilibrium is reached between the ERT torque and the HPP and ERT tandem starting friction torque. The tandem starts rotating with motor off (point A Fig.2).
- BP is kept at the discharge pressure of 12.5 Bara for 40 seconds. During this time HPP and ERT keep on accelerating and absorbing the BP hydraulic energy. At the end of this phase the HPP rotation speed approaches 1670 rpm and the discharge pressure 31 Bara (point B Fig.2). The HPPT is in so-called “motor-off” or “turbocharger” mode of operation.
- The HPP motor is started with the current ramp. After approximately 40 sec the HPP discharge pressure reaches the nominal one.
It should be stressed that all the figures given above are specific to the selected equipment and cannot be extrapolated to other cases.
The maximum pressure at the end of the free rollup (point B) is easily derived from the energy balance equation written for HPP and ERT.
where Psuc and Phpp stand for suction and discharge pressures of HPP, rec – membrane recovery, ηhpp, ηert – the efficiencies of HPP and ERT, γ – pressure loss between HPP and ERT as the Phpp fraction. From equation (1) it follows that if rec=0, ηhpp = 1, ηert =1 than Phpp -> ∞. In other words the Phpp/Psuc ratio measures the HPP-ERT tandem match goodness.
The equation (1) is useful only for rough estimates of the point B location as the denominator all items depend implicitly on the Phpp value. Besides it doesn’t relate the rotation speed to pressure.
The predicted performance of BP and HPP at point B as a function of the HPP suction pressure is summarized in table 2. As follows from table 2 an increase in the suction pressure of HPP is not accompanied by a similar increase in the HPP pump TDH value because of the reverse osmosis gaining strength. In our case at the HPP highest suction pressure of 200 m the membrane recovery approaches 18% at the product output of 25% of the nominal value, specific energy consumption being by only 25% more than that at the design point. Combination of the feed low pressures and low rotation speeds keeps the HPP and ERT efficiencies above 78%.
The HPP-ERT tandem transient performance during startups and shutdowns is governed by the following angular momentum equation for the rotating mass.
where ![]() - time, MI – total polar moment of rotational mass inertia for the HPP, ERT, the motor rotor, couplings and shafts, Tert, Tm, Thpp – torques of ERT, motor, and HPP.
- time, MI – total polar moment of rotational mass inertia for the HPP, ERT, the motor rotor, couplings and shafts, Tert, Tm, Thpp – torques of ERT, motor, and HPP.
The predicted transient performance of the HPP and ERT tandem for the free rollup phase is given in Fig. 4. It shows the net torque developed by ERT, the HPP TDH, and rotation speed (rpm curve) as functions of acceleration time. As seen the HPP discharge pressure increase rate is fairly below 1.0 Bar/sec.
In accelerating HPP crosses a number of regions. From 0 to 400 rpm HPP is in “fanning” mode of operation producing no pressure, and from 400 to 750 rpm in the “run-away” mode characterized by low efficiencies and possible cavitation noise. At the HPP suction pressure of 120 m the ERT starting torque is high. It means that to break the friction torque of the HPP and ERT tandem much less pressure is needed.
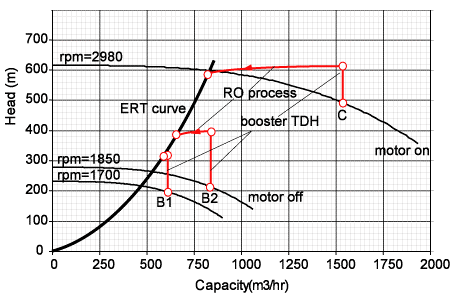
Fig.3 High-pressure train performance map: B1, B2 – the end of the free rollup stage (B1 – HPP suction pressure - 120 m; B2 – 190 m); C – design point
Table 2 Predicted performance of the HPP & ERT tandem at the end of free rollup and the motor off
| BP rpm | BP TDH, m | HPP suction, m | HPP rpm | HPP flow, kg/sec | HPP head, m | HPP efficiency | HPP power, kW | ERT TDH, m | ERT flow, kg/s | ERT efficiency |
| 1237 | 116.8 | 120 | 1617 | 165.7 | 176.3 | 0.7775 | 369.5 | 287.9 | 164.9 | 0.7938 |
| 1291 | 127.0 | 130 | 1671 | 173.6 | 187.6 | 0.7819 | 409.7 | 308.6 | 170.7 | 0.7932 |
| 1343 | 137.2 | 140 | 1694 | 182.9 | 190.6 | 0.7918 | 433.0 | 320.8 | 174.1 | 0.7907 |
| 1393 | 147.5 | 150 | 1714 | 192.1 | 192.8 | 0.8010 | 455.0 | 332.3 | 177.1 | 0.7883 |
| 1441 | 157.7 | 160 | 1733 | 201.4 | 194.6 | 0.8092 | 476.5 | 343.3 | 180.0 | 0.7861 |
| 1489 | 168.0 | 170 | 1752 | 210.4 | 196.1 | 0.8164 | 497.7 | 354.1 | 182.9 | 0.7842 |
| 1535 | 178.3 | 180 | 1771 | 219.7 | 197.5 | 0.8228 | 519.3 | 364.6 | 185.6 | 0.7826 |
| 1579 | 188.6 | 190 | 1791 | 228.8 | 198.7 | 0.8282 | 540.6 | 375.0 | 188.2 | 0.7812 |
| 1623 | 198.9 | 200 | 1810 | 237.9 | 199.7 | 0.8328 | 562.0 | 385.2 | 190.7 | 0.7800 |
Different scenarios of the HPP motor soft start have been tested. As has been found that only the current ramp startup keeps the pressure increase rate below the afore-mentioned value (Fig.5). As seen during the first 20 sec the current (I) is gradually increased from 150% to 380% of nominal current (In). After ramp it is kept constant. The HPP suction pressure (“Suction” in Fig.5) is assumed to be constant.
Figs. 6-7 show the data for the startup that is substantially less sensitive to the soft start ramp conditions. To achieve this, BP is overloaded up to the maximum design pressure of the discharge piping (20 Bara) at the discharge pressure rise rate of 0.5 Bar/sec. The BP’s VFD startup procedure should be programmed to the constant pressure rise. The pressure of 20 Bara is enough to raise the rotation speed of HPP and ERT tandem up to 1850 rpm and the HPP discharge pressure up to 41 Bara. During the soft start the BP discharge pressure is constantly decreased down to the minimum sustainable pressure (about 9 Bara). As follows the soft starter should be rated at least for 300% of current for 40 seconds.
The stop simulation (Fig.8) shows that during the first 3 seconds the feed pressure drops from 60 Bara to 40 Bara. Such a rapid decrease in the feed pressure warranted some insight into the soft stop alternatives. Two modes of the soft stop have been investigated – decreased voltage and voltage ramp. The first mode slows down the pressure drop to about 1.0 Bar/sec at the voltage of 55% of the nominal value. As shown in Fig. 9 after 18 seconds the motor is completely switched off. The transient performance of HPP during the soft stop with voltage ramp from 100% to 0% over 80 seconds is represented in Fig.10. (Some manufacturers limit the ramped stop to 60 seconds.) It was found that during the first 32 seconds of the voltage gradual decrease the HPP performance is not changing except for the current rise from 100% to 170%. After the voltage has dropped below 60% of the nominal value the HPP and ERT tandem starts decelerating. This mode of the soft stop takes more time and is less effective but a standard in-built option.
Both soft stop modes cause the current to rise up to 250 – 300% of the nominal value for a short period. Generally it poses no problem as the thermal limits of the typical motor allow working up to 200 – 400 seconds at the current of 300% (Fig.14 – Motor overload time against current). Nevertheless any lengthy overload should be avoided as it eventually shortens the motor life. This aspect should be taken into account in selecting the best stop strategy.
The HPPT turbocharger mode resulting in zero water output and decreased feed flows (35 – 45% of nominal values) may be effectively applied as a control response to the low-level and low-flow alarms from the feed tank, any trips in the second pass of the plant and the post-treatment system, the high-level alarm from the brine outfall system.
Summary
- Soft starter for the HPP motor is an effective solution for a plant with frequent start/stop occurrences.
- There are no ready-to-use soft start/stop procedures suitable for any plant and any process conditions. Every case should be analyzed separately.
- The developed software has been proved to be effective in step-by-step analysis of plant transient behavior.
- The turbocharger mode of operation with zero water output can effectively prevent nuisance trips and be readily applied for “on-the-fly” membrane cleaning.
- The data obtained from the transient analysis (currents, torques, start/stop duration) allow optimal sizing of the soft starter be done.
- Dimensioning of the BP and HPP drive systems is a task where all factors have to be considered carefully. It requires knowledge of driven machines, main processes involved, motors and variable speed drives. Time spent at the dimensioning phase can mean considerable cost savings.
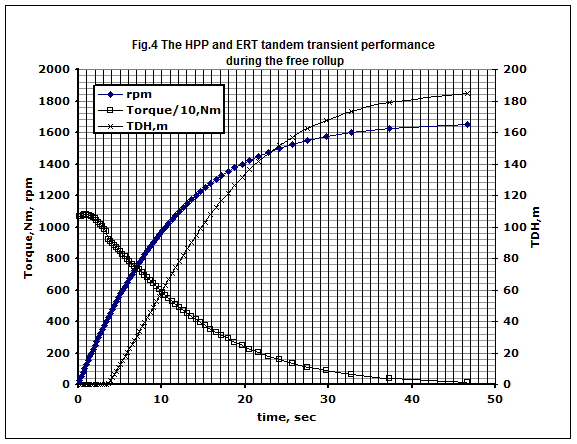
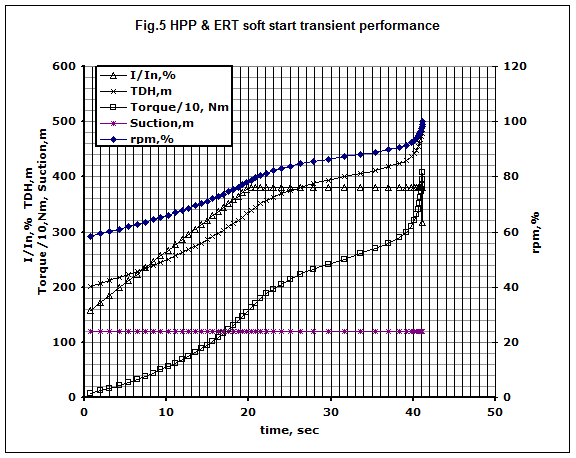
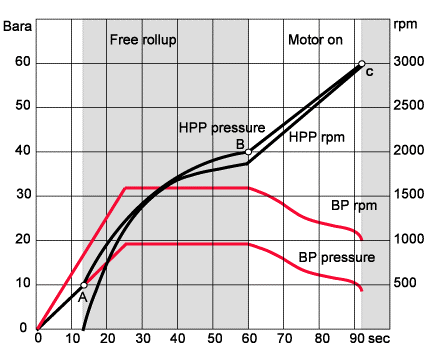
Fig.6 Quick startup diagram: (O-A) – booster operation region, (A-B) – HPP and ERT free rollup; (B-C) – motor soft start
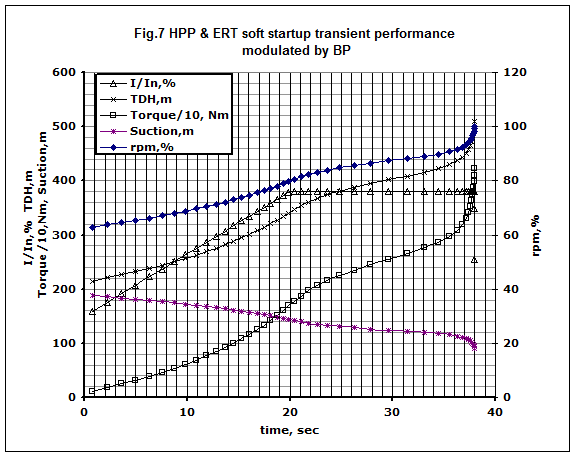
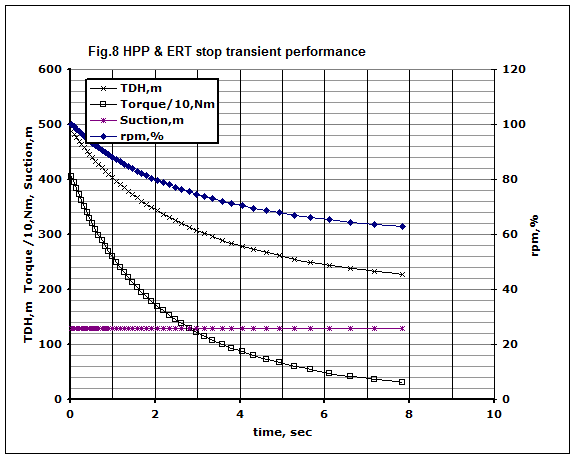
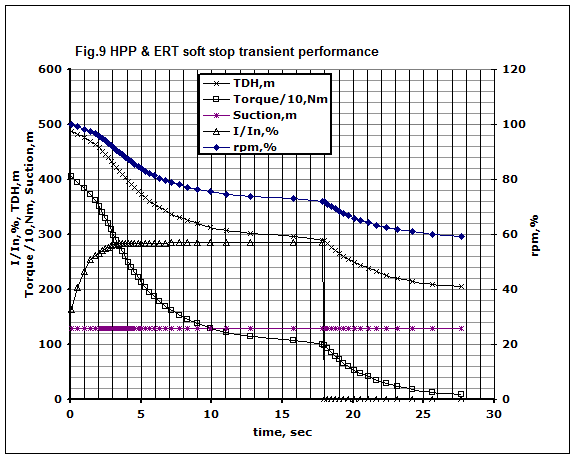
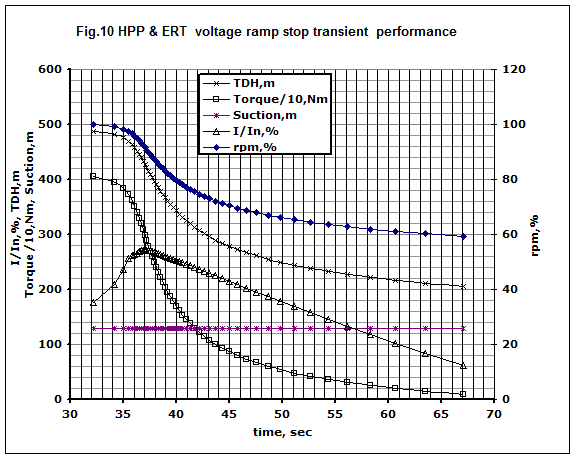
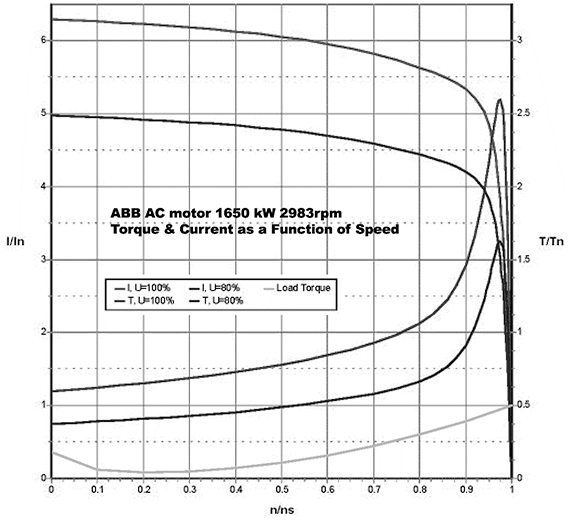
Fig. 12 ABB AC motor current-rpm and torque –rpm curves
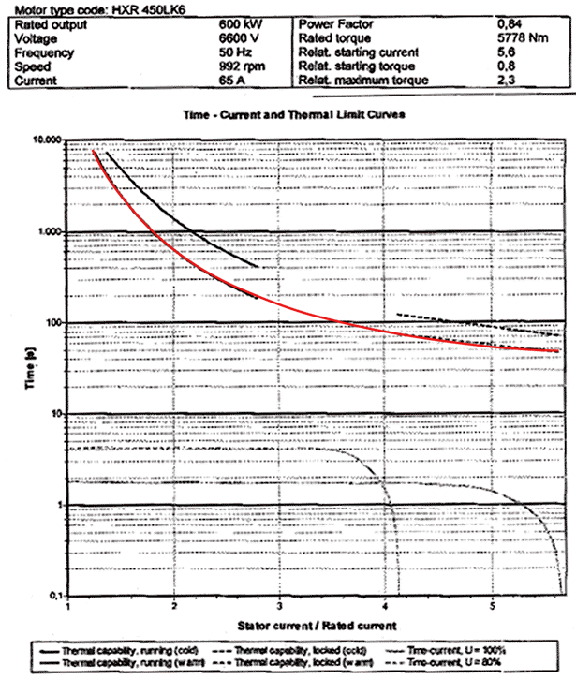
Fig. 13 ABB AC motor thermal limit curves
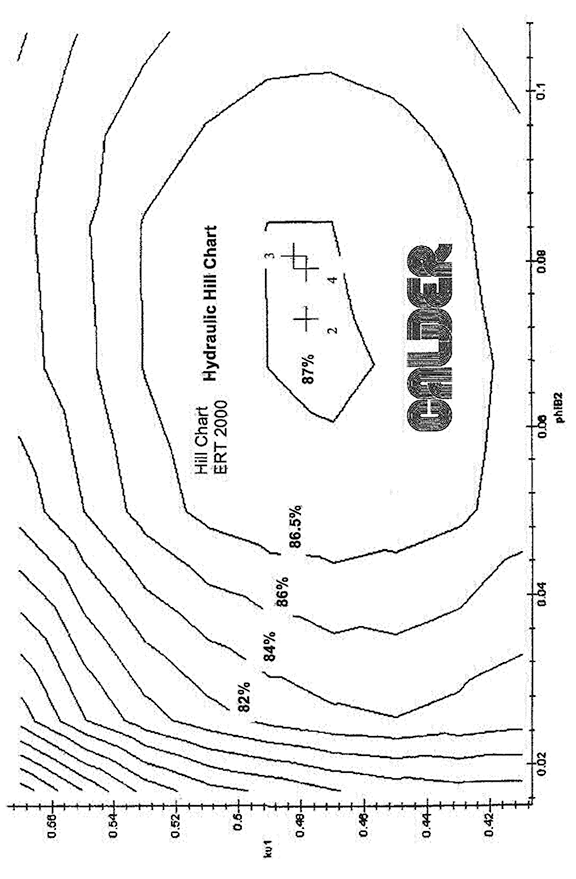
Fig.14 ERT “hill” chart
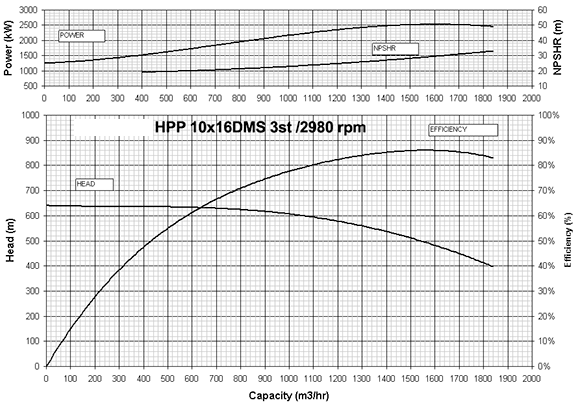
Fig.15 The HPP performance curves
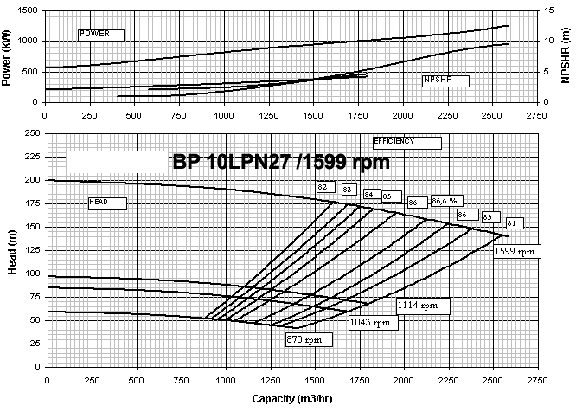
Fig. 16 The BP performance curves