
Lately one of my LinkedIn connections asked me the same pesky question I have answered innumerable times - What is the energy consumption of desalination?
To me, this question betrays either ignorance or strong academic backgrounds as the consumers of desalinated water get their bills in dollars, not in kWhs. So the down-to-earth question would be about the desalination energy costs of water delivered to customers.
This question immediately lets systems thinking into esoteric desalination engineering as it balances production with the consumption of water and electricity.
Desalination by reverse osmosis favors continuous stable loads, likewise fossil-fuel power stations. Green power generation is inherently unstable and varies hourly and daily. Water consumption goes through daily, weekly, and seasonal cycles.
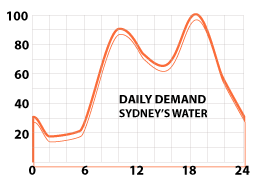
Below is the hourly consumption graph for Sydney's water. Its variation is 80%.
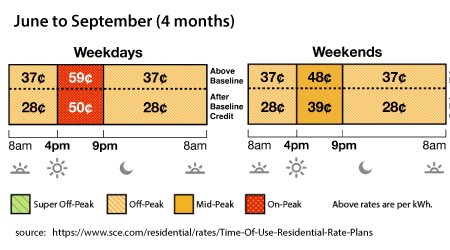
To make matter worse, the electricity tariff - the conversion factor from kWhs to monetary values - varies daily, weekly, and seasonally as well. In California, for example, the on-peak rate is nearly 2 times higher than the off-peak one. In other words, the price of water produced from 4 pm to 5 pm will be about 60% higher than that of the one produced from 3 pm to 4 pm.
Does knowing the answer to the above-mentioned question add a competitive advantage?
It depends on the contract type. For EPC contracts focused on the lowest CAPEX, the answer is negative. For the PPP contracts that gained popularity in the last 10 years, it is definitely positive as they sell water at a fixed price for as long as 15 - 25 years. (Actually, the price is slightly adjusted depending on the contract provisions.)
To assess the gain in competitiveness I refer to the Sorek 2 desalination plant under construction by IDE Assets. The water price set by its PPP contract is nearly 30%(!) less than that of the twin plant commissioned in 2014 and located a hundred meters away from the former.
The new price prediction was solely based on actual feedback from the old plant, with any technological advances being excluded. Otherwise how one can explain that Hutchison Water, the former partner of IDE in the Sorek 1 project and a main competitor in the Sorek 2 project came up with a similar price? Unlike IDE, Hutchison never claimed to be a world leader in desalination.
As the energy component of the water price may be as high as 60% for seawater desalination, the price reduction is mostly a consequence of the accuracy increase in the desalination energy costs prediction and optimization of the production-demand scenario.
Given the megaproject bid preparation costs, we may say that the desalination energy cost prediction is a million-dollar question separating winners from losers.
To turn this question into a trivial one, crenger.com came up with a framework including only 2 elements - the digital twin for the plant operation and maintenance (DT) and the pattern-modeling library for temporal processes. I touched upon the former in my previous article "From Bids to Digital Twins".
The idea for the pattern library came from air conditioning. It usually works when ambient temperatures are above some level, so electricity costs are a function of the electricity tariff, the air temperature, and the day hour. So the air conditioning pattern P is a function of the 3Ps :
P = P1*P2*P3, (A)
Using this fundamental property of patterns we may decompose any sophisticated pattern into much simpler ones. Equation A and its derivatives are at the core of the pattern library developed by crenger.com.
An example of the problem solved by the pattern is a prediction of a time value from a series of monthly seawater temperatures. The pattern turns any input into the step-wise periodic function of time.
t = f(time), (B)
As a wrapper around the DT, the pattern has 2 core features. It may control the DT behavior by setting boundary conditions like the plant operation limits. Next, it implements standard functions set like minimum, maximum, duration, integration, variance, sorting, filtering, etc. Finally, the patterns may communicate through control events.
So annual energy costs are the integral function of the instant power demand multiplied by the electricity tariff over the time span of the year at a step of 0.5 hour. One may imagine the computational loads!
But the real power of the Pattern + DT combo is in the optimization of the production-demand scenario. It is very similar to a generative design applied in CAD.
Generative design is massive computer iterations over design parameters within the bounds of constraints to maximize the performance criteria of the device or system.
The simplest form of generative design is the plant operation stress test aiming at finding out the weakest link in the plant network of subsystems.
It works in the following way. The DT is incrementally loaded till some subsystem signals critical overloading. The designer approves the system redesign and resumes the plant overloading till the next alarm. The gap size between the adjacent alarms is the criteria to stop the stress test.
The generative design gives a definitive answer as to how to achieve the highly flexible operation needed to avoid desalination at on-peak tariffs or high-recovery desalination much talked about last years.