
This guide is introductory, its purpose is to describe the scope of practical problems addressed by Crenger. It is a companion to the PlantDesigner User Guide.
Three points define the evolution of desalination plants – performance efficiency, operation flexibility, and remote control and monitoring. All of them have a common part – the plant automation pivoted around instrumentation and control systems design (ICSD).
Crenger platform for ICSD targets the case when the plant automation is outsourced and is SCADA-based - the preferred choice in mega-projects. Today, the term SCADA refers to the entire process automation and control system.
Outsourcing follows the main automation contractor (MAC) model. It is managed by the same platform. This removes a serious drawback of MAC – the project execution in a silo without sharing information, best practices, and philosophies. Additionally, Crenger brings transparency into execution, testing, and commissioning.
ICSD is part of the process engineer's assignment as ICSD is deeply rooted into the process basics. As a sequence of tasks explained below, ICSD is unmodifiable and mandatory. Some steps are executed by the engineer, others – by Crenger.
 Download PDF version.
P&ID
Crenger re-uses P&ID images for SCADA HMI development. It is the first big step towards bridging the gap between P&ID and SCADA. Moving to a single source of graphical data becomes possible due to removing from P&ID all the data storable in a database and implementing best-in-class P&ID development standards (recurring items and recurring design patterns, hyperlinking, etc.)
All the control data are moved from the P&ID image to the instrumentation and control interface.
P&ID item alarms
By ANSI/ISA‐5.06.01-2007 alarms should define the process safe operation envelope and possible consequences and guiding steps if the process goes awry.
P&ID item sizing is the best time for alarm core definition. It includes measured values range, scan rate, process safety time, alarm deadband, and data acquisition destinations explained below.
After the alarm is registered, its definition is automatically extended to the full one. It additionally includes status (when true or false), associated process module state (described below), signal transformation recipe (transfer function (TF) describe below), signal type, signal device, lifetime, recovery, and severity-emergency data. All the definitions are customizable.
The values range may include low-low/low or high/high-high values or both. If the process engineer disregards them, crenger.com sets them automatically.
Scan rate and process safety time are interrelated: both reflect the abnormal process dynamics. The scan rate shows how fast the measured value is updated by the data acquisition system. Process safety time (PST) sets the limits for the operator SUDA - See, Understand, Decide, Act (Alarm Management for Process Control, Douglas Rothenberg). The PST selection is the process engineer's responsibility, and it has serious consequences. If PST is not sufficient for decision-making, two options are available. The first is to change alarm settings. The second is to move to automatic response – a drastic change in the plant automation design. Automatic response opens door to the remotely operated plants.
Deadband answers the question of how reliable the measured or calculated value is in the abnormal metastable operation. Here the process engineer does not make a final decision - she/he just sets intuitive values – a good beginning for alarm rationalization.
Severity-emergency data scope is described in the ISA-5.06.0-2007 "Functional requirements documentation" standard. In its current version, crenger.com does not set these data automatically; it provides the user interface for this purpose.
Plant control hierarchy
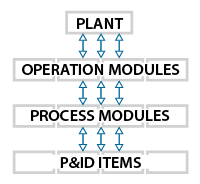 The plant control design shall start from the plant subsystems' hierarchy. It includes 2 distinct levels - process modules and operating modules - serving different objectives.
Plant, operating module, and process module have the same visible basic states: General Fault, Not Ready, Ready, Running, Not Healthy. The latter is an alias for abnormal operation. States are mutually exclusive in the same mode of operation (described below). The process module has two additional transitional states – Starting and Stopping. In addition, the process module Not Healthy state has priority levels. They are implicitly defined by the module service. Its types include main, auxiliary, continuous, and batch. Each type may be attributed with a standby or not option.
The plant state is defined by the operating modules, while the operating module state is defined by the process modules. The process module state is a combination of the P&ID item states and actions. An example is the "open" state and the "to open" action for a valve.
The above-mentioned plant hierarchy solidifies and further extends the recommendations developed by EEMUA 191 (UK) and NA 102 (Germany) standards. "Whereas EEMUA 191 suggests the opportunity to link plant states to alarm and process conditions, NA 102 lays out the expectation to affirmatively do so" (Douglas Rothenberg).
Process module is the lowest level; its task is described by a single verb like to pump, to filter, to backwash, etc. To produce some product we link a number of modules together.
Process module does not equal P&ID; it may include only part of it, or be extended to adjacent ones. (P&ID is a legacy notion primarily tied to the A3 paper format.)
An operating module is a group of process modules; its task is to stop the propagation of the emergency shutdown (ESD) upstream. It may coincide with project areas (like intake, pretreatment, etc.) introduced to implement concurrent engineering - the workhorse of project management. In this case, the operating module is implicitly defined. ESD is a cornerstone of the alarm philosophy.
ESD strategy
Unlike process module interactions described by the math graph, the operating modules are always connected in train. We start the plant by starting the first module, then the second one with all the successive modules being idle, etc. If the plant design meets the startup propagation downstream, it is automatically ready to block the ESD propagation upstream.
The ESD scenarios are different for modules upstream and downstream of the failed one. Downstream modules join the last and begin automated ESD. Upstream modules implement Safe Park by shedding the load to the minimum sustainable level.
This ESD strategy substantially decreases the damage by the plant operation interruption and the time needed to restart the plant.
Automated ESD is the SCADA programmed sequence of actions not requiring the operator's intervention. To explain its generic character, let's consider two pumps - the booster and the high-pressure one - connected in a train. The process engineer knows that the booster shutdown will damage the main pump. Therefore the booster ESD must start the main pump ESD. This sequence equally works when the main pump fails. In our case, the automated ESD replaces 2 conventional ESDs. But it requires process expertise.
Moving to automated ESD requires understanding compound and Transfer Function (TF) triggered alarms and interlocks. Both are different flavors of the event.
A compound event is a micro-sequence of simple actions void of responses found in the normal start/stop sequences. TF is a transfer function calculating alarm setting out of a number of signals. An example is the maximum flowrate of the pump, which depends upon the pump rotation speed. Another example is the mean square root of the pump XYZ vibrations. TF is discussed below.
PM states implementation
Process module (PM) is a node on the Process Flow Diagram, Reliability Block Diagram, Commissioning Route, and Plant Health monitoring. All the nodes are interlinked. PM as the P&ID items' group automatically solves the problem of Alarms Grouping - the starting point of Alarm Rationalization.
Depending on the module service, even if it is in the Fault state, the Plant may be considered Healthy.
If PM has a number of operating modes, states shall be created for each mode. For example, the dual‐media filter has 3 main modes: Duty, Backwash, and Air scouring. It is simultaneously in a Running state for backwash and Not Ready state for the main filtering process. Similar modes exist for ultrafiltration and reverse osmosis. They are periodically interrupted with backwashing or CIP. All the PMs have common modes – maintenance and standby.
To implement PM states means to link the state to a combination of the wired item states and events.
For example, the process module is considered in the Running state if all the drives are in the running state too. Crenger provides an interface for visualization and aggregation of P&ID items states and events and the plant subsystems states.
The natural order of states is Fault, Not Ready, Ready, Not Healthy, Running. To activate Crenger auto-generation algorithms, the following order shall be used: Fault, Ready, Not Ready, Running, and Not Healthy.
P&ID item events, alarms, and faults
Events, alarms, interlocks, and ESDs are at the core of discrete-state control accounting for over 90% of work hours spent on ICSD.
From the control point of view, any wired P&ID item (WI) is a source of events and states. They make WI remotely visible. WIs include limit and proximity switches, meters, valves, and electrical drives. All of them have different sets of states and events. For example, the flow meter has an abnormal "Fault" state described by digital input and a normal "Value" state described by the analog input. The DOL‐started motor has much more individual states and events – Start/Stop, Fault, Running, Field Ready, Start From Field, MCC Ready, and others.
The available collection of states and events shall be customized - trimmed or extended – before moving to auto-generation of states and events for each WI and cable terminal (junction box, terminal box, panel, MCC, and switchgear).
Alarms selected during the items' sizing are turned by Crenger into soft-wired events automatically.
The bigger the plant, the more signals and events shall be coded into the SCADA program. Some metrics of the desalination plant are shown below.
Table 1. 150 MLD SWRO desalination plant discrete control metrics
| No | Control event category | Quantity |
|---|---|---|
| 1 | Events | 2350 |
| 2 | Equipment modules states | 340 |
| 3 | Alarms & States | 9100 |
| 4 | Interlocks | 520 |
Alarms prioritization and suppression
Alarms prioritization and suppression (APS) are a final part of the alarm's definition explained above. APS start from grouping the same priority alarms. An alarm with a lower probability shall have higher priority. An example is the bearing's temperature and vibration. Compared to the former, the latter is by far more common.
To implement APS faster, the P&ID items of PM shall be logically interlinked. For example, the level transmitter shall point to the vessel, the flowmeter - to the piping piece, etc. Further, process knowledge is needed to decide when alarm suppression shall be applied. For example, overloading of the pump accompanied by vibration increase may trigger the high-high load alarm and high-high vibration one. In this case, the latter shall be suppressed. It can be done automatically if both alarm sources point to the same pump.
The APS logic is described by a tree structure. It includes alarms with the same meaning, like high flow rate and VSD high load as the latter is a consequence of the former. The next step is the alarm's pattern identification. It assesses the probability that alarm A and alarm B will start within a time less than the process safety time (PST) and be initiated by the same root problem. If the answer is positive, they are siblings of the alarm tree node.
Alarm tree directly relates to the alarm categories. Category 1 alarm is activated without restriction. This alarm is the tree root. Category 2 alarm activation is permitted pending being inhibited. It is a tree leaf (child) controlled by the root (parent). Category 3 alarm activation is inhibited pending a permissive. It is a leaf from a priority-ordered sequence of leaves (siblings). The priority may be dynamically set by using the recipes' interface.
Safety interlocks
Interlock describes a system response requirement to predetermined conditions caused by the system malfunctioning (safety interlock) or the process sequencing (process interlock).
The ANSI/ISA‐5.06.01-2007 standard defines interlock as a single cause-and-effect link between initiating and control devices.
This definition is not applicable to safety interlocks in the multi-hierarchy control systems – the current standard for big water treatment plants.
For example, a high-pressure reverse osmosis unit includes at least 3 pumps. Any safety interlock shall shut down the pumps in the proper order to avoid equipment damage. Such interlocks usually initiate the plant ESD described above. They are compound in nature and very similar to failure sequences; their logic is described by Boolean math and even includes other interlocks.
A safety interlock ALWAYS describes the process module operation, not equipment pieces. Phrases like "safety interlock or ESD for pump or motor" is a misnomer.
Crenger auto-generates safety interlocks triggered by pump/motor failure by linking all the LL or HH alarms generated by the instruments installed on the pump set and its piping to the drive's shutdown event.
Crenger allows building compound, sequential interlocks of any complexity by using Boolean Math.
Crenger addresses special cases when the safety interlock is initiated by a number of High or Low alarms from the same equipment piece like the high-pressure feed pump (having over 30 sensors). Boolean math's condition for such an interlock cannot be written manually. Instead, it is auto-generated by Crenger.
Crenger auto-generates the cause-and-effect matrix.
Control loops
Control loops are not visible on P&ID, they entirely exist in the database. A control loop is described by a number of attributes: control objective, control type, PID controller type and settings, signal (error) sources, final control elements, transfer function (TF) type, redundancy, hazard level, induced losses, and HMI alarm trigger.
PM start/stop sequences
Start/Stop sequences are the last validation of the plant design compliance with the project functional requirements regarding the process module automation. Sequences clearly show whether the process module (PM) is fully-automated, or semi-automated.
Usually, sequences are followed by P&ID item multiple updates. Manual valves are replaced with the actuated ones, and additional meters are added.
Crenger offers a visual editor for the operation sequences development, which is rooted in the following protocol. The operation sequence is considered a chain of action steps and response steps. An action step is an unordered collection of actions like ‘to open a valve’ or ‘to start a motor’. By analogy, the response step is an unordered collection of responses such as ‘valve is open’ or ‘motor is running’. Inside the step the order of items – actions or responses is irrelevant: swapping items produces the same result.
The PM Ready state is a precondition for the startup sequence. If PM is linked to other modules, its Ready state depends upon the state of its predecessors. The PM dependencies are part of start/stop sequences: they define their startup preconditions. For example, the SWRO unit cannot be started without the pretreatment system in operation. Dependencies are defined only for interlinked process modules.
Nearly every startup sequence shall end up with control loop activation. The default normal shut-down sequence is created automatically by reversing the start-up sequence.
Mapping P&ID items to plant plot
It is the first step of the plant wiring and plant noise map generation. To execute mapping, the user opens the layout and some P&ID with items to be mapped. Click on the item is followed by the click on the layout. The item already mapped are not shown on P&ID.
Mapping PLC and MCC groups to plant layout
PLC and MCC groups divide the plant plot into the wiring areas. These groups contain Serials (not P&ID items!) that shall be wired to PLC or MCC accordingly. To group serials, the user shall select the polygon area on the layout. All the serials inside the polygon will be grouped automatically. Crenger analyzes the power consumers. If they have different voltages, Crenger automatically creates additional MCC groups and moves serials to the proper voltage group.
Auto-wiring
At the core of auto-wiring lies unsupervised machine learning algorithms. Auto-wiring includes three general tasks.
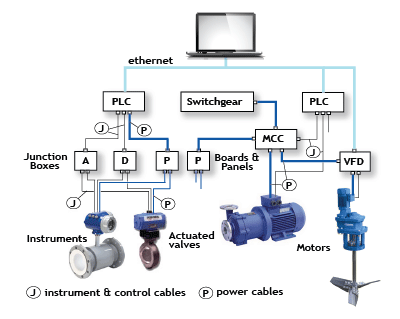
First, Crenger auto-selects the locations of instrumentation junction boxes (analog, digital), remote drops, control cabinets with PLCs, terminal boxes and power panels, MCCs, and switchgear. Then it wires instruments, motors, and VFDs to the aforementioned terminals. The engineer may modify if needed the proper location of the terminals.
Finally, Crenger selects the instrumentation, control and power cables, and the cable glands, and creates the Bill of Quantities (BOQ).
One-line electric diagram
Power auto-wiring additionally includes the selection of power transformers and generation of the one-line electric diagram. It is responsive – it may be navigated and edited. All the data on MCC and transformers are mapped to the purchase order datasheets.
PLC I/O modules
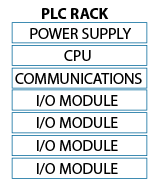 In simple terms, PLC I/O modules act as messengers between the Central Processing Unit (CPU) and P&ID wired items like meters.
The input modules receive signals from switches or sensors and send them to the CPU and the output modules take back the CPU signals to the control devices like control valves or VFDs.
Selecting I/O module types and connecting modules to cables and to devices are not a trivial task as it generates a huge volume of data describing the logic and physical addresses of signals. Their metrics are given in the table below.
Table 2 I/O quantities for 100 MLD plant
| No | Operation modules | AI | AO | DI | DO | RTD |
|---|---|---|---|---|---|---|
| 2 | intake and pretreatment | 124 | 24 | 582 | 176 | 32 |
| 3 | SWRO | 147 | 11 | 313 | 94 | 40 |
| 4 | BWRO | 129 | 8 | 376 | 98 | 34 |
| 5 | Total | 400 | 43 | 1271 | 368 | 106 |
Crenger automates this task. It selects the I/O modules and the PLC rack capacities, wires cables to modules, and creates PLC addresses. Then it auto-generates I/O module wiring diagrams and creates BOQ. The Crenger I/O viewer allows navigating the I/O modules and racks.
Instrument hookup drawings
Crenger considers the hookup drawing as an extension of P&ID: elements that may be shown on the hookup drawing, shall not be shown on P&ID. This drawing contains the details of the P&ID instrument assembly like exact location, fastening, and process and electrical connections.
Crenger moves all the information about the hookup items (tubing, elbows, connectors, etc.) from the hookup drawing to a database. This information may refer to the assembly and manufacturing drawings, the manufacturer's catalog, datasheets, and the project specification of instrumentation and shall be verified before submitting the hookup drawings to the subcontractor. By the author's estimate, about 50% of all the 'as-made' hookup drawings (already used more than once) contain errors or misprints.
Crenger not only auto‐generates the hookup BOM (bill of materials) and the hookup specifications with all the relevant information on demand but also checks the applicability of the hookup drawing to the specific instrument, the fluid conditions, and the materials.
Inspections and tests
Equipment inspections and tests number and approval procedures shall be selected based on the available resources allocated to Quality Assurance and Control. Test witnessing and the approval points bear a heavy impact on the project schedule.
In this step, the engineer selects inspections and tests for instrumentation and control equipment types described by the special selectors. They, in turn, project all the inspections and tests onto the P&ID items.
Commissioning checkpoints
This step uses the identical procedure. The designer customizes the checkpoints list, adds new points, and attaches them to special selectors (or uses the default attachment).
Examples of checkpoints are calibration and testing of instrument prior to installation, instrument earthing, power and instrument cable labeling, etc.
Using generic points list, Crenger auto-generates actual checkpoint records for all devices. The records number may be well above 20 thousand.
Instruments order packages
Once the equipment pieces and the instruments have been specified, they shall be grouped into procurement packages. Auto-grouping takes into account the pieces' similarity (equipment class, size) and the Original Equipment Manufacturer (OEM) range of products. Grouping is a three-step process. Crenger creates default packages using the patterns already recorded in a database from previous projects. After this, the user may merge some packages according to her/his expertise. Thirdly, Crenger gives hints regarding which packages are desirable to split due to differences in the lead time. Finally, Crenger checks the eligible OEMs and if the quantity is less than three, signals the alarm.
After the purchase order packages have been assembled, they shall be linked to the preferred payment scheme. It is conditional: every step payment is conditioned by the manufacturing schedule stage results. User may select already pre-built schemes or create a new one. Linking ranges from manual to automatic. The latter uses the patterns from the previous projects.
Assembled purchase order packages shall be linked to specifications describing general requirements for the equipment class. User may add new specification or edit the existing one with the web application. Linking options range from manual to automatic. The latter uses the patterns from the previous projects.
Spare parts and instruments stock
One should differentiate between the spare P&ID item and the spare part for the P&ID item. The former is defined by the plant designer, and the latter – is predominantly by OEM. The spare items auto-selection algorithms are based on good engineering practice rules, lead times, and approximate MTBF values.
The algorithms address the worst-case scenario when the plant is maintained by the O&M company not sharing resources and stocks with other plants.
Plant data acquisition
The primary question to plant data acquisition (DAQ) is whether it matches the remote operation and is adequate for the plant operation assessment, periodic testing, trend analysis, troubleshooting, and reporting. If not, P&ID shall be amended.
DAQ validation starts from the classification of the outputs collected from the plant instruments. Signals are used for safeguarding, control, and remote operation monitoring. In the plant control hierarchy, the visibility of signals has the following levels: local, process module, operating module, and plant. In addition, different destinations (database, HMI display, messaging, web) may be selected.
Given the safeguarding and control design already executed during P&ID development, the DAQ focus is on selecting the data for operation monitoring. This process is boiled down to Operation Data Templates (ODT) creation. ODT explains how requested performance criteria or parameters may be obtained from measured signals. For example, the fluid volume remaining in the tank is a function of the fluid level and the tank cross-section area. The latter shall be present in the tank specification. The ODTs list is auto-generated for each PM.
ODT is more than just a function, it contains the input detailed description and, what is more important, hyperlink to P&ID or its item specification.
The above function is called Transfer Function (TF). It has access to measured data and static data describing the physical assets through the links to instruments and assets. So TF may be considered a gatekeeper for information exchange. This role explains the "transfer" word in TF.
TF is a workhorse of ADAQ – any data acquisition system – receiving, labeling, sorting, transforming, and broadcasting data to various recipients. Naturally, TF absorbs all standard signal conditioning functions of PID controller like totalizing, reversing, log, etc.
TF is ubiquitous. It is used for the plant design validation, control loop and alarm definition, equipment performance rating, data visibility, priority definition, and data streams destinations. For a mega-plant of 100 MLD capacity, ADAQ should serve about 300 instruments and have access to nearly 30000 static parameters and over 550 TFs.
Currently, 90% of required TFs are auto-generated. An example is volume-left TF for all open tanks or operating data for centrifugal pumps and motors. What about 10% left? The Crenger OTD editor does the job.
Process control narrative
Process Control Narrative (PCN) describes how the process shall be operated and controlled. It is sometimes called Control Philosophy to emphasize the value of deep inter-disciplinary expertise. In practice PCN is considered a supplement to P&ID; it is prepared after the long-lead equipment sizing and quotation requests.
PCN aggregates the information for an instrumentation engineer to program SCADA. After the plant handover, PCN becomes a basis for operations practices review and alarm rationalization over the entire plant lifecycle.
Crenger auto-generated PCN for every process module. The current compiler version addresses the following information pieces. (All the tags in generated scripts are hyperlinked.)
- P&ID excerpt
- Equipment list
- Instrument list
- IO list
- Measured value set points and ranges
- Control loops list
- Operation modes
- Operation statuses for each mode
- Valve matrix covering modes and statuses
- Normal startup/shut-down sequences
- Alarms and interlocks list
- HMI instructions and messages
Commissioning
Commissioning includes checks of instrumentation installation and wiring, instruments calibration, actuated valves calibration, valve switches test, alarm and interlocks checks, control loop checks, and process module checks. The scope of work is auto-generated by Crenger for each PM.
All forms, checks, and certificates are filled out online. A typical certificate contains a reference documents list, the process data, excerpts from P&ID and layout location. As progress reporting is web-based, the commissioning metrics are in real time.
Equipment functional test
Often failure to execute the functional test is explained by the lack of high-precision instrumentation, incorrect installation of instrumentation, and far-from-ideal testing conditions requested by the proper international standards. These points shall be reflected in the P&ID and conveyed to clients as early as possible.
Abnormal operation troubleshooting
An alarm is raised when the process leaves the normal operation region. Two scenarios may be applied to return the process back to normal – automatic correction or a manual one. Both start the troubleshooting sequence. The Crenger editor for the latter is very similar to the one used for startup/shutdown sequences. Additionally, it includes the interface for recording the troubleshooting procedures submitted by Original Equipment Manufacturers with the products.