

Since the publication of the ANSI/ISA-S5.4-1991 (Instrument Loop Diagrams) standard, the water industry has been debating whether the diagrams contribute to the project's success or not.
By the standard, the instrument loop diagram (ILD) is a collection of symbolic and textual information (a.k.a database) about an instrument and all associated electrical and piping connections.
As the minimum database content requirements set by the standard are, in fact, extremely wide, the plant designers trim it to fit the top-priority task - the onsite control equipment assembling and wiring. A slightly abridged version - Instrument Wiring Diagram (IWD) - is stripped of the control functions data (interlocks, alarms, signal ranges, software connection, etc.) that is normally copied from the P&ID-associated documents.
Both ILD and IWD are not perfect in conveying the information - they represent the instrument-centric view. It is normally complemented with other views centered on the junction box, marshaling cabinet, or the PLC rack slot.
IWD may be defined as a bill of part quantities and instructions on how to wire the control equipment pieces together. As wiring is the final stage of the project construction, the IWD preparation finalizes the instrumentation and control systems engineering.
The root of dissent regarding IWD usability is a lack of resources for and high cost and time requirements of the IWD database preparation. For a grass-root desalination mega-plant of 200 MLD, the workload surpasses 1000 man-hours (!) needed to collect and cross-check data and prepare over 1500 IWDs.
Outsourcing this task introduces a new unknown that affects the project progress - the time needed for contractor onboarding. 90% of it is climbing the learning curve. In other words, outsourcing the IWD database makes matters worse. The lack of IWDs automatically leads to a work scope creep impossible to control.
It is a vicious circle - to outsource the instrumentation wiring the project owner should prepare IWDs but it normally has neither resources nor time to do that.
Crenger.com entirely automated the IWD generation. It uses template drawings (wiring schemas) mapped to the instrument classes. An example of such a drawing template for a 2-wire instrument is shown below.
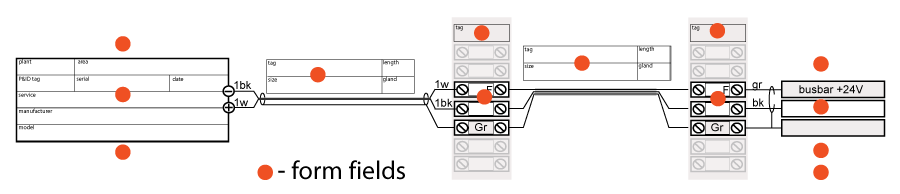
As seen, the template combines fixed text fields and an image showing a chain of wired equipment pieces from a field instrument to a junction box, PLC cabinet, and IO card.
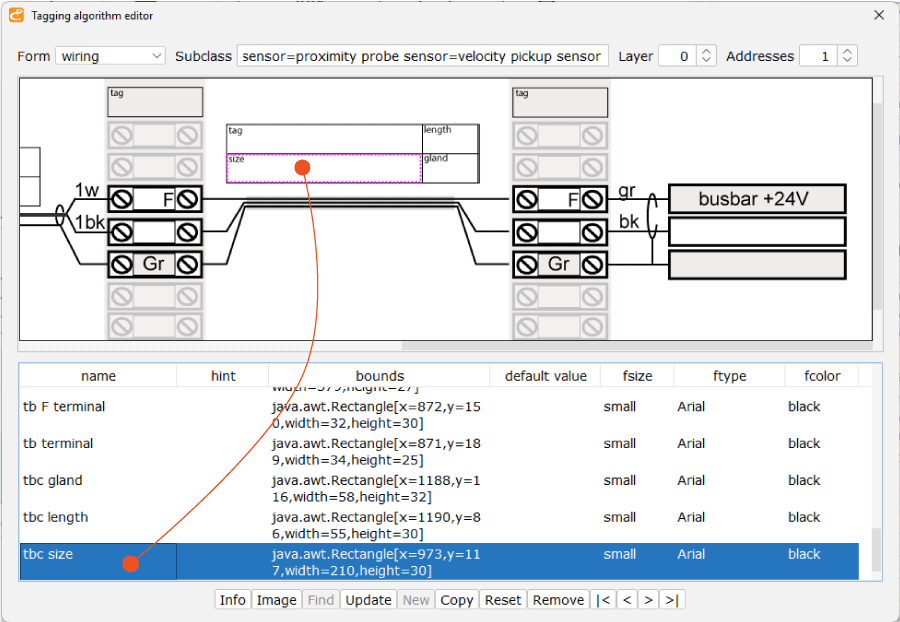
To map a text to a drawing an image form editor shown below is added to the PlantDesigner software. The user selects an entry from the bottom table and then selects the rectangular area on the drawing. The same editor is used for the P&ID item nameplate creation. Entries in the table may be added. removed, or edited. The text of the image form may be placed on different layers. For instance, one layer may contain all the analog signal data, and the second - the data for the discrete one.
The auto-generated IWD image may be quickly retrieved online using the instrument location map. The image is embedded in the web application tracking the wiring progress.
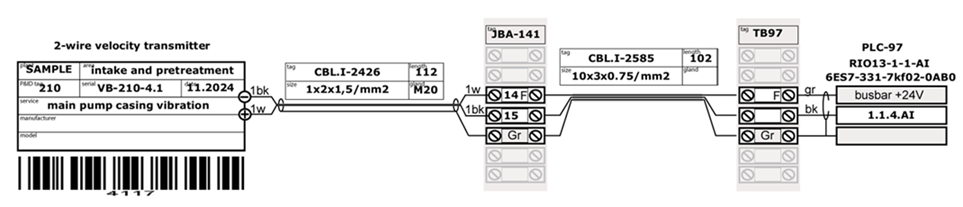
The final question is how the IWD database is prepared. It is auto-generated after the plant auto-wiring. Hence, the time required for 1500 IWDs preparation is zero.