

Project engineering and management generate massive amounts of data. It features a mixed format – part of it is structured, while other is not. It cannot be fed to AI systems without first identifying its missing parts and structures, which shall affect how data is transformed and integrated during its ingestion.
The project data generated by crenger.com is represented by two structure types – tree and graph. The latter is exemplified by the following documents.
- Process flow diagram (PFD)
- Piping and Instrumentation Diagram (P&ID)
- Reliability Block Diagram (RBD)
- Plant underdrain network
- Control modules architecture
- One-line electrical & instrumentation diagrams
- Plant (power and control) wiring topology
- Project execution schedule
- Plant commissioning sequence
- Plant system functional tests sequence
What differentiates all the above-mentioned graphs is domain-specific data structures encapsulated into the graph nodes (vertices) and links (edges).
To make the wealth of plant topology information available to AI systems (by infusing it into LLMs), it should be transformed into a graph view, which edges and vertices are of a well-known predefined format. This requirement makes the project data interoperable.
This view is called a knowledge graph (KG) as its primary goal is to capture the project execution reasoning through the project taxonomy and ontology.
In a nutshell, taxonomy is a LEGO construction set, while ontologies are instructions as to how to assemble different objects from the same taxonomy. The taxonomy provides a hierarchical classification structure that categorizes business entities and concepts, and standardizes its vocabulary. Process engineering introduces a rich set of system and device taxonomies. One of them is an exploded view - a tree-like diagram that shows a device's components separated by distance to illustrate how they fit together. The ontology attempts to describe the business process within the taxonomy envelopes.
Knowledge graph auto-generation is a critical milestone in the project data completeness validation. Its procedure is part of the crenger.com validation framework. This validation focuses on the logic behind engineering decisions described in functional requirements specifications.
The current graph auto-generation algorithms are optimized for a set of specific tasks related to training designers, operators, and project managers. More data-rich versions are required to implement Agentic AI that participates in the project decision-making. Owing to the knowledge graph, it becomes explainable and auditable.
The basic schema of the plant knowledge graph is shown below. Here, a group of P&ID items is not the P&ID but rather a node of the Process Flow Diagram (PFD). It reflects one of the cornerstone requirements of P&ID development - PFD and P&ID shall be contracted and expanded views of the same Plant object. This requirement necessitates moving from the conventional PFD to its advanced version – Plant Modularization Diagram.
Plant→Group of P&ID items (Group)→P&ID item (Item)←P&ID Symbol
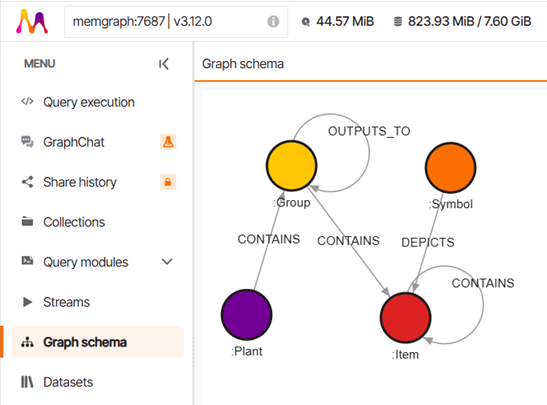
The P&ID symbols depict item connections on the P&ID, governed by such modern concepts as item aggregation and stacking, recurring item patterns, symbol overloading and overwriting, and item grouping that may be expanded or contracted. Symbol overloading and overwriting allow integration of P&IDs from different engineering services providers without re-drafting them. In other words, the WYSIWYG rule is not 100% applicable to the P&ID items.
The graph vertex/edge data has the following core structure
{labels, parameters, annotation, embedding}
Labels – Plant, Group, Item - categorize entities, concepts, and domains. Parameters are a collection of key-value properties, and the annotation explains the device's purpose. The embedding field contains a low-dimensional vector – the output of the parameters conversion that retains semantic and structural properties. Labels, parameter names, and annotations define the vocabulary of the knowledge graph.
The knowledge graph auto-generation includes 5 main steps.
- Encode the P&ID item into a properties text
- Run the text through an embedding model
- Save the resulting vector directly onto the vertex or edge as a property
- Create a vector index over these element properties so the graph database can handle vector similarity searches natively
- Create a text index on the element annotation
Standard vector embedding dimensions typically range from 384 to 3,072, with common sizes including 384, 768, and 1,536. The lower the dimension, the faster the search times and the lower the storage needs. Higher dimensions provide richer context and deeper understanding of complex data, but require more memory and compute. Low dimensions are a reasonable starting point for a knowledge graph optimized for personnel training.
Crenger.com stores the knowledge graph in the graph database. It may be queried using the Cypher language. It combines intuitive syntax, versatility, and advanced operations. For example, the query retrieving all the groups has the form: MATCH (g:Group) RETURN g.
Under development is the API for querying the knowledge graph directly using JSON. It includes a native query and the parameter list as shown below.
REQUEST
{ "queries" : [ { "query" : "MATCH (g:Group {id: $id}) RETURN g", "parameters" : { "id" : "405" } } ] } REPONSE (abridged)
{ "g" : { "_labels" : [ "Group" ], "properties" : { "annotation" : "pressure filters are installed before the SWRO membranes to maintain low SDI", "standbyCapacity" : "100 %", "installedCapacityUsage" : "100 %", "operatingReserveCapacity" : "10 %", "communications" : "PLC", "UPSPowered" : "no", "turndownRatio" : "0.1", "service" : "main continuous", "startup" : "fully automated", "function" : "filtration", "name" : "EM-4: pressure dual media filter 1", "embedding" : [ -0.04874121770262718, ... 0.02264726348221302 ], "id" : "405", "category" : "process module" } } } Currently, the graph database contains only the “SAMPLE” project. It includes 52 groups, 1275 items, and 38 symbols.