In assessing the environmental impact of the future desalination plant we tend to focus on the impact of brine discharge on marine life. This problem often distracts us from the second point of our concern - noise pollution.
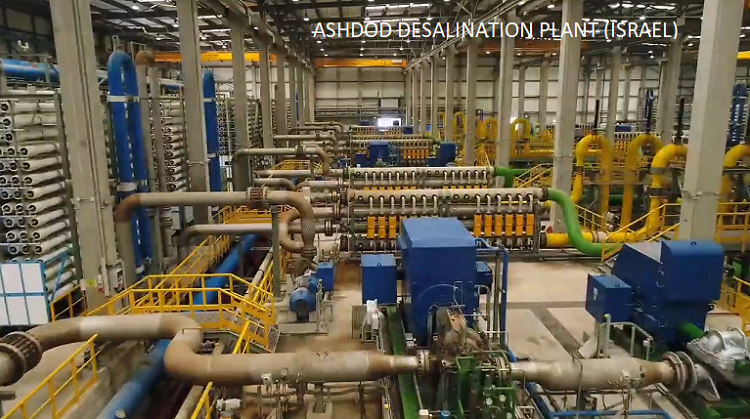
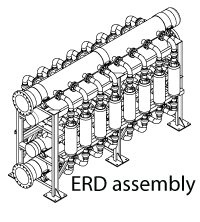
Its biggest contributors are the SWRO and BWRO trains including high-speed pumps and motors, throttling valves, and energy-recovery devices (ERD). For example, the noise produced by a single ERD manufactured by ERI is 94 dBA. When measured in a group of 16 ERDs it surpasses 125 dBA. For comparison, the noise produced by airplanes is 140 dBA.
Why noise should be a point of concern for any mega-plant designer?
Noise abatement is costly in CAPEX and OPEX. The big-capacity pump with noise-abatement shroud is over USA$ 15000 more expensive. (Acoustic enclosures maybe even more expensive.) Besides, it makes maintenance more difficult as the shroud hides the maintenance points. More space should be allocated to equipment (to provide for the shroud disassembling).
The only effective ways of no-cost noise abatement are moving to water-cooled motors, avoiding the usage of variable speed drives, proper selection of the piping support, and application of hydraulic straighteners inside the piping fittings.
Not willing to deal with case-by-case noise abatement, the plant designers default to placing equipment inside the noise-attenuating building. It is an epiphany of no-revenue investments.
In other words, noise is the decision-making parameter.
This is a reason why noise emission assessment (NEA) is the inherent part of a mega-plant bid. (NEA is part of Environmental Impact Assessment.)
It should answer two questions set by industrial standards. What are the A-weighted sound pressure levels (SPL) at the boundaries of the plant? How long may the maintenance personnel work in noisy areas?
NEA is as accurate as the data it uses. Most OEMs disclose data with unsatisfactory 3-dBA accuracy. The theory says that this value is an increase in the noise if we combine two sources with the same sound pressure level.
This point prioritizes the data collection over an attempt to build a perfect all-embracing calculation model as the one described in ISO 9613-2:1996 Attenuation of sound during propagation outdoors Part 2: General method of calculation. In an awkward manner, it introduces corrections for obstacles, ground absorption, reflection from walls, etc.
Normally NEA is outsourced to small businesses not versed in desalination plants. So the price of NEA absorbs the contractor's learning curve and the data collection. It may take several weeks while the software run itself – only seconds.
As a rule, the produced output from the first run does not answer directly the two questions set above. Worse, it is often discouraging. To optimize the acoustic design multiple runs are needed, which may double the budget and affect the project timeline.
These are the points behind the noise analysis plugin developed by crenger.com. It automates 2 time-consuming points – the definition of the noise emission by the equipment pieces, and mapping them to the plant layout. The latter uses the data from the plant wiring.
In defining sound pressure levels Crenger.com uses a two-step approach. If noise data cannot be extracted from the database, it is calculated using well-accepted procedures. For example, the noise emission by the pump set is a log summation of the motor noise value taken from the manufacturer catalog, and the bare pump one measured during its test or calculated based on its characteristics.
Crenger.com autogenerates the noise emission map of the plant from P&ID. The map may be viewed and downloaded online using the web or PlantDesigner. The exported noise data format is suitable for usage in other software programs. Below is an excerpt from the noise map with isolines.
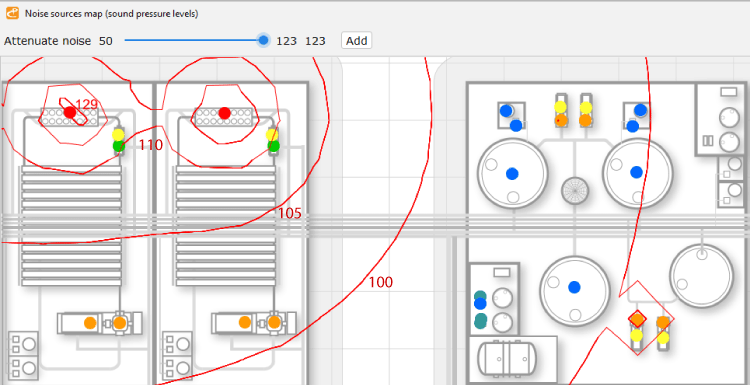
One of the practical results of the NEA is the conclusion that the most popular layout of the SWRO trains shown below has the worst acoustic design.