
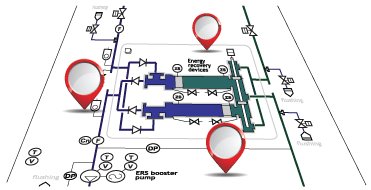
 The desalination megaproject is inseparably tied to several diagrams: process flow diagram (PFD), piping and instrument drawing (P&ID), and the plant general layout (GL).
PFD may be defined as a deliverable set of documents defining the constituent processes functionality and sequencing necessary to provide the required product quality and quantity. PFD is a synopsis of the project and a declaration of the design targets set for the whole plant and its main and auxiliary systems.
The constituent process definition should include load, design capacity, standby capacity, load duration, and potential design uncertainties.
Usually, the PFD set of documents includes a graph of processes, their annotations, and mass balance tables for main operation modes. For reverse osmosis desalination plants, these tables should additionally include chemical dosing rates and pH values along the process path.
What other purposes does PFD serve?
- PFD is the specification for P&ID development.
- PFD is the basic input for the Functional Requirement Specification as the major equipment modules (blocks) of the plant are already there.
- PFD has enough information to produce the GL draft.
- PFD is the input for the Work Flow Diagram - the sequence of the project's major activities.
For P&ID drafting any drawing program may be used: MS Visio, Adobe Illustrator, AutoCAD or even MS PowerPoint. Visio is inexpensive and produces good-quality graphics in all known image formats: gif, tiff, jpg, png. Illustrator, renowned for the best quality graphics, is the favorite. The last version of AutoCAD is expensive and obviously an overkill. Besides it doesn't produce good-quality images needed for internet-linked activities. (P&ID images generated with these programs are the input to Crenger.)
Sometimes engineers especially those not versed in data management try to use specialized packages linking drawing software like AutoCAD to the raw database like MS Access or Oracle. At first glance those graphics-driven programs seem appealing: symbols and some textual data become bi-directionally linked. But the end is the same - customization failure. The main reason is that the P&ID graphic symbols are an abstraction - like the top of an iceberg - hiding the wealth of information beneath the water level. This information hierarchy and laws are unknown to the graphics-driven programs. Their customization in practice turns into hard work from scratch. Trying to plug these programs into an already existing ERP system may be a very expensive enterprise doomed to failure as the programs in question are not built for networking.
Another point to be reckoned with is the poor maintenance and service of these programs as the dedicated staff usually does not have any knowledge of the process engineering. A serious problem associated with the above programs is the lack of qualified users - the engineers avoid practicing drafting by all means, and the draftsmen are not qualified enough to manage the drawings database. As a consequence, many engineering companies in the water industry have no internal graphics standards. Not seldom "improved" PFDs are used instead of P&IDs for small-capacity-unit projects. As a rule, such P&IDs have no one-to-one correlation between the diagram symbol and the database entry. It is said they don't fit into WISWIG - "What I See What I Get" - the mainstream concept of the programs in question. And the legacy P&ID problem is still left unsolved.
There are numerous graphics-driven programs for P&ID development available on the market
In the lack of means for the P&ID data management, P&ID itself turns into the project data main repository. It becomes overloaded with various kinds of seemingly unrelated information pieces - the pump performance data, piping, and fitting sizes, ground and water levels, valve design details (rotary valve of ball type or butterfly one?), number of solenoids in the pneumatically actuated valves, and even the assembly drawings of the injection nozzles for chemical solution. Attempts are being made to standardize this information chaos.
Another serious problem of a conventional P&ID is the necessity of its multiple views targeting different clients and associated security constraints.
P&ID implementation views
| View | Features |
|---|---|
| Quotation | Implementation “know-how” details are omitted |
| Basic engineering | Control details are omitted. Industry standards are simplified or disregarded. |
| Advanced engineering | Full implementation of engineering standards and industry practices |
| SCADA HMI | Non-control details are omitted |
The solution to the above-mentioned problems is straightforward once one accepts the fact that P&ID is the worst kind of database ever known as its data cannot be read by computer.
P&ID development criteria adopted in Crenger
| Task | Task weight,% | Task criterion |
|---|---|---|
| Learning process basics | 30 | More general and simpler symbols are better |
| Detail design | 30 | P&ID is a browser of database |
| HMI & SCADA design, commissioning, operation | 40 | Affinity to control logic concepts and entities |
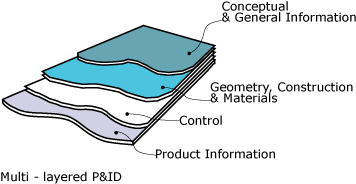 Crenger uses a multilayered P&ID approach - the upper (graphical) layer contains only conceptual and general information about the process and its means. The P&ID symbols provide effective shortcuts to other layers of information - item geometry, construction and materials, control and electrical data, and product information. The upper layer is a "common denominator" readily understandable by all personnel involved in the project - process engineers, electrical and control engineers, project managers, mechanical engineers, unit operators, technicians, and drafters. It can be said that P&ID is a roadmap of the project.
To most of the P&ID experts, the task of teaching everybody to read P&ID (upper layer) may seem absurd bearing in mind recent heavy updates of the industry standards introducing more complexity and new abstractions (in a single layer) and a work grandiosity - IEC guys invested more than 7 million US$ and 12 years of hard work into ISO 14617 "Graphical symbols for diagrams" (ISO Bulletin March 2003).
Use-case analysis shows that the personnel with basic technical backgrounds easily handle the task of deciphering P&ID compiled of 67 generic symbols carefully sorted out by Crenger and denoting already known common-knowledge abstractions. For comparison, similar complexity abstractions - road signs include 47 warning signs, 68 direction signs, 61 information signs, and 20 road markings.