
Even though project scheduling is one of the most famous research topics, its automation principles are yet to be discovered in a mess left by the classic management theory.
This mess is epitomized by the review entitled "Optimization algorithms in project scheduling". For anybody with a math background, the title raises a simple question – If we do not know the automation algorithms, how can we talk about optimization?
Albert Einstein is quoted as saying "We can't solve problems by using the same kind of thinking we used when we created them."
Today our thinking is chained to Gantt Chart and a belief that it is about the time category and constrained resources. We continue assessing the project complexity by a number of activities, failing to accept the fact that the messy world is essentially non-linear.
Our language betrays our mindset linearity. The mentioned above paper gives the following description of the scheduling first step – "initialize the ordered activity list". From a math point of view List cannot be used instead of Unidirectional Graph (UG) simultaneously capturing and recording the activities' concurrency and sequencing. Isn't it accidental, that the "concurrency" keyword is never used by the above paper?
Sequencing is the business know-how, logistics being part of it. But the real gem of UG is the ability to store in the database the decision-making logic. Given digitization accelerating activities, shall one consider the project scheduling as knowledge mining first and the time minimization second? Rephrasing the quote of Lynn H. Hough about life, one may turn the above question into a guiding principle: Scheduling is a journey and not a destination.
Limited Resources
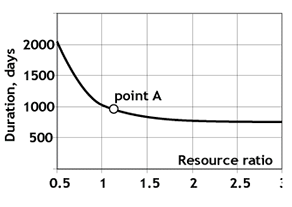
Resource-constrained project scheduling is the most heavily researched problem type. Digitization relaxes the resource constraint by automating the project activities. Remote work creates a pool of skilled workers available on demand. New conditions do not eliminate the above constraint but transform it into the function shown below. It describes the resources' effect on the project duration. As seen, if the whole world participated in the project, it would not be erected overnight. The same result, different meaning.
Project Complexity
No doubt, projects become more complex and schedules bigger. In desalination megaprojects, the activities count is well above 1500. For many "complex" means insurmountable wall, for others – the game theory playing with concurrency, probability, and mutating project conditions. It changes our perspective on the project from deterministic to probabilistic.
Scheduling + Complexity = Forecasting
Complexity means farewell to the baseline planning in a conventional sense and hello to betta distribution, Markov chain, and Bayes' rule. Markov chain is the probability model of linked events like sick leaves of the team members. Bayes' rule allows us to handle "cause-and-effect" cases where the occurrence of one event may trigger the others. These cases contribute most to the project's failure. Both methods are heavily used in Machine Learning and Complex Systems Science.
The first fundamental probability-centered observation is that sequencing amplifies the project uncertainty while concurrency dampens it. (Why project managers are horrified by concurrency is the focus of the "Concurrent engineering" article.)
Another source of growing complexity is a shift to environmentally friendly carbon-free technologies. An example is a solar-powered desalination.
To make such a complexity more manageable, the management theory introduced Work Breakdown Structure (WBS) and Work Package (WP) abstractions. This is an extraordinary example of systems thinking as the former is generic while the latter hides the problem specifics. WBS and WP are scheduling pattern in infrastructure projects.
The given above interpretation of the scheduling problem was the starting point for the automation framework developed by crenger.com and bundled with PlantDesigner software (available for free download). It includes a generic graph library for UG manipulation, a scheduling controller (SC), and a graphical user interface for network visualization. Customized UG is a big step forward as it avoids the logical fallacies of GERT.
SC is where automation magic begins. SC hosts 5 abstractions – Task, Work Generator, Scope, Scope Object, and Work Predictor.
Task
The Task abstraction is similar to the scheduled activity and represents the building block of UG. It is rather heavy: its database table contains 40 columns.
Work Generator
Work Generator (WG) is a direct superseder of the Work Package. WG is a unidirectional graph of activities with anchoring points. They allow plugging the WG outputs into a bigger graph. By making WG smaller than WP, crenger.com turns it into a pattern scoped by a discipline and/or the project phase. WG pairs the activity with the client's submittals describing the activity result. The current framework contains over 30 WGs.
Scope
To generate the schedule piece and fit it into a schedule, WG needs Scope - a group of Scope Objects. The project as a graph of Scopes replaces WBS. Scope Object is anything related to the project execution from engineering report to purchase order package to equipment inspection. The scope is superimposed on activities; different activities may work on the same Scope. Scope Object has two fundamental properties: it "generates" uncertainties and hazards. Uncertainty may relate to cost, time, quality, or even environmental impact. Most of the scope objects are created automatically based on previous experience; their number depends on the project complexity. Usually, it is above 120. Comparing this number to 1500 activities mentioned above, one may say that each Scope Object is reused multiple times. It is a clear case for Machine Learning.
Predictors
Crenger.com introduces predictors for the equipment delivery time (lead time), activity workload, and cost. They may work with preset probability distributions. One of them is the betta distribution. It is also known as three-point estimation that uses pessimistic, most likely, and optimistic values. This elegant approach (PERT) first introduced in the 1950s by US Navy never beat a path onto large projects due to the large amount of manual work. Information technologies (IT) erode this barrier. (Other types of more practical distributions are discussed elsewhere.)
Every Lead Time Predictor is tuned for a specific class of equipment. This predictor type is extensively used for the purchase order contents auto-aggregation and optimization.
Work Load Predictor is a critical link in the automation chain. If Scope is known, WG selects Predictor for each Scope Object and uses its attributes for the activity load calculation. For instance, to estimate the workload of preparing the wiring diagrams for the project area, the predictor may use the I/O list extracted for this Scope Object from the FEED database. Currently, the crenger.com database contains over 330 "most likely" predictors. This database may be easily extended through the user interface shown below. 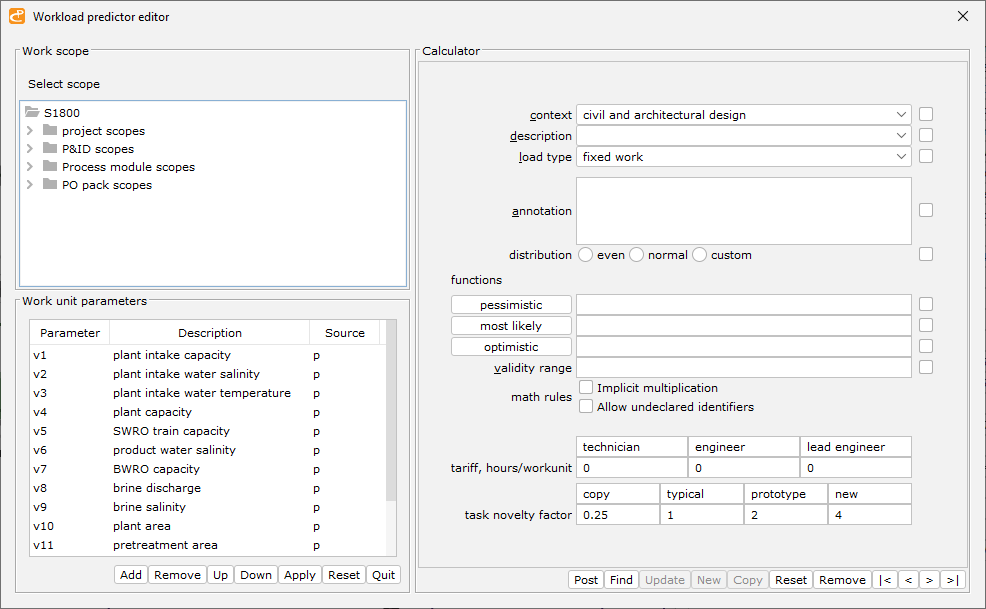
Schedule Auto-generation
To auto-generate the schedule, cringer.com uses the plant P&I diagrams, reliability diagram with subsystem interdependencies, wiring data, the project metrics, and the purchase order packages. Before auto-generation, the Schedule Controller validates all the data to be used in scheduling and pre-builds the schedule settings. The project schedule wizard guides the user through 5 steps of the customization of the settings regarding the main contractor, the order of the project areas in the plant erection sequence, the purchase orders sequence, the commissioning sequence, and the extended scope.
After the schedule is created, its Tasks shall be linked to subcontractors, project managers, and the project team members. It may be done with the resources editor. The auto-generated schedule may be easily exported to Excel and MS Project Manager.
Schedule Analysis
The scheduling framework contains most of the standard tools for schedule analysis. They are listed below.
- the critical path and the shortest paths selector
- the longest tasks filtering
- the tasks type metrics
- the distribution of the tasks (concurrency level) over the project duration
- the resource loads distribution over the project duration
- the s-curve chart (cancellation charges)
- resources requirements
- resources usage over the project duration
- the project duration sensitivity to the quantity of the resources
- slack time minimization
Schedule visualization
Bundled with the PlantDesigner the schedule graphical interface is built for working directly with UG. Its primary purpose is the schedule creation and update. It is rather complex for the project stakeholders other than the plant designers. Often, they only require the project schedule summary represented by the Gantt Chart. PlantDesigner offers 4 standard conversions of UG into the Gantt Chart: work package related (L1), discipline related (L2), project phase related (L3), and all executable tasks (L4).