The datasheet-based quotation of a desalination mega-plant is an industry standard. It has not undergone any changes for the last 25 years.
The mega-plant datasheets summarize design, construction, and performance details of all major equipment pieces and subsystems. Performance is assumed to be tied to a single point corresponding to the plant's maximum output.
This standard approach to quoting immediately raises the following questions.
Why does the quotation not include any data about the plant performance and its subsystems' interactions at different environmental conditions and the plant's partial loads? How do the plant systems work at other points referenced, for instance, in the process flow diagram (PFD)? As PFD is part of the warranty package, such unanswered questions substantially increase the risk of project failure.
The said questions are well expected, bearing in mind that the plant datasheets are actually an abridged version of technical quotations that are obtained from original equipment manufacturers (OEM).
Normally, they include computer printouts of the equipment performance simulations for conditions requested by the plant designer. The said computer simulations define the performance warranty limits not only for the purchased equipment pieces, but for the whole plant too.
Equipment pieces never purchased without the computer simulation include agitators, ultra-filtration and reverse osmosis membranes, pumps, reactors, ion exchangers, static mixers, etc. It is an unbreakable law in the desalination industry.
Extending this law to the mega-plant requires a transition to predictive performance (steady-state) modeling (PPM) that absorbs all the computer simulations mentioned above. PPM makes datasheet-based quotation redundant. Transition to PPM is a strategic imperative as it sets a company above the competition.
PPM is a comprehensive topic. It starts with the definition of the PPM core outputs. The first one is lumped performance data of the plant's main equipment pieces over the course of the year. (The same lumped perspective is applied for P&ID transformation into PFD.)
PPM shall reproduce with precision the main equipment interconnections. The sequence of computation slightly changes with the plant configuration. Typically, it is of the following order.
- Reverse osmosis membranes of the first pass
- Energy recovery and booster pump
- High-pressure feed pump
- High-pressure and low-pressure boosters
- Micron cartridge filters
- Multimedia filters or ultra-filtration system
- Intake piping and intake pumps
- Reverse osmosis membranes of the second and third passes
- Second pass feed pumps
- Limestone reactors
- Product transfer pumps
The PPM output contains 120 – 150 parameters. The plant systems match is validated by running PPM over the time of the year. Time-dependent parameters include seawater temperature, salinity, SDI, and turbidity, air temperature, fouling of seawater intake piping, micron filters, and reverse osmosis membranes, daily electricity tariffs, and plant production.
Plant validation is defined as a clean operation without alarms signaling operation outside of the design range. These alarms shall be copied from P&IDs.
The second output is the failure times of equipment pieces. Some of them do not require the plant shutdown. The third output is the list of preventive maintenance tasks. The superposition of the said three output categories may substantially change the plant operation and maintenance schedule.
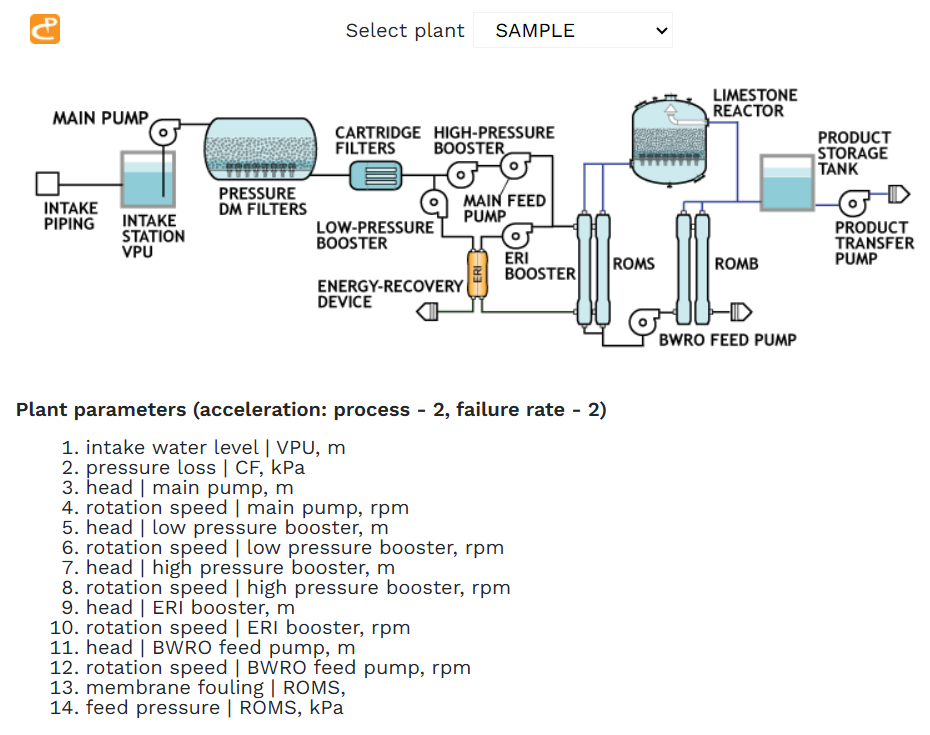
The main elements of the web interface for the plant predictive performance model visualization are shown below. When the user selects the plant, the plant PFD pops up. It contains all the elements of the PPM.
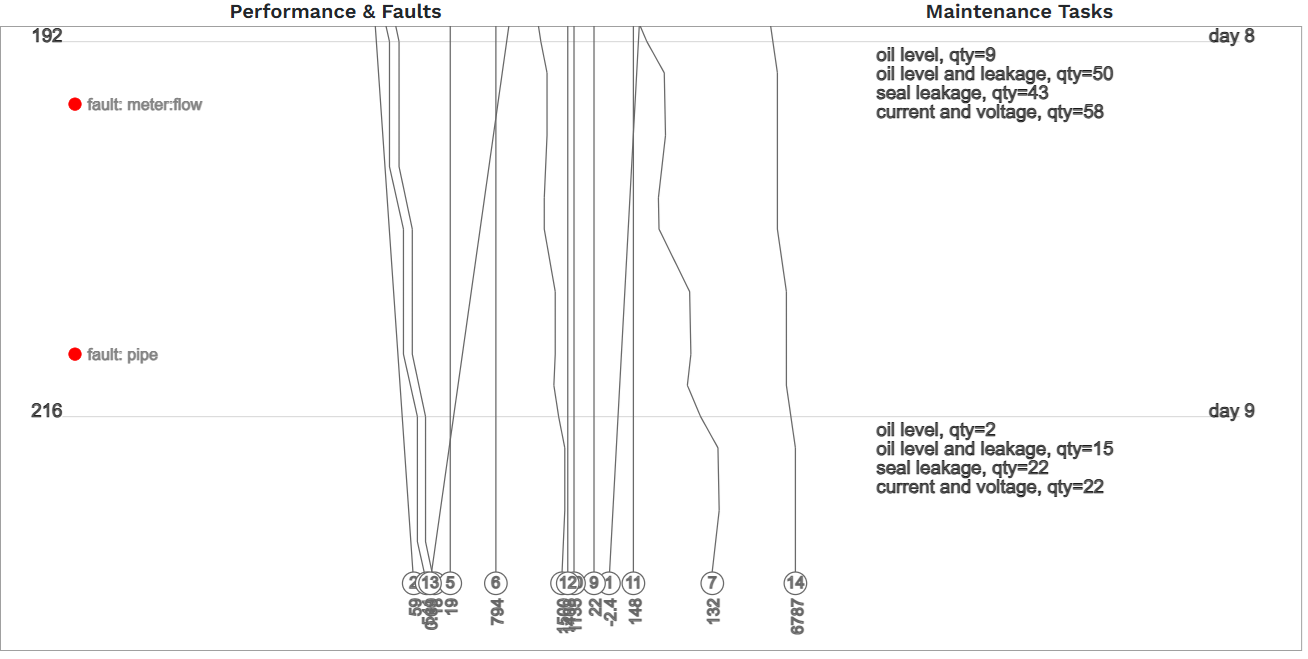
Next, the user selects the element parameters from a menu (of 136 entries) that are tracked during the PPM run. When the Run button is pressed, the screen shows time-bound drift of the element parameters, equipment failures, and daily maintenance tasks.