

Quotes comparison in megaprojects is a challenge. It requires a lot of time, procurement expertise, and experience in selecting comparison points that matter. Heavily biased decision-making counteracting the lack of information is commonplace.
To alleviate this challenge and stay within the project schedule, companies resort to the practice of selecting 2 – 3 quotes they feel are worth their time and dumping the others without any assessment. I did it myself in any megaproject I participated in.
Quotes Comparison Automation (QCA) will do away with the bad practices described above, substantially accelerate procurement, and lead to better quality and lower prices of the quoted products and services.
As the industry demonstrates zero experience in QCA, it should be an extension of an expert system focused on task uncertainty. Both terms – expert system and uncertainty – relate to fundamental knowledge. It is a pillar of modern digitization, overlooked by the majority of experts.
Quote Comparison Table
The first basic task of QCA is the generation of the quotes comparison table (QCT). Its template is shown below. Its first column lists the product features to compare, the other columns contain the feature values. The template rows and columns are sortable in the order of significance. The user has the option to hide rows with identical feature values or columns with unacceptable quotes, all being selected automatically.
| Products | Best | Better | … | Worst |
|---|---|---|---|---|
| Feature 1 | . | . | . | . |
| Feature 2 | . | . | . | . |
| Feature 3 | . | . | . | . |
Creating QCT sounds simple till we begin comparing apples to oranges, and this is why QCT is called an expert system.
The first set of features is of go/no-go type; it includes the Original Equipment Manufacturer's (OEM) quote completion, the survey status, the references list completion, the manufacturing location, and the payment schedule acceptance.
To illustrate the level of the decision-making detail for this group I refer to a purchase of the seawater intake rotating band screens. The XX company which won the two last orders was disqualified because it had no references for the product with an installation depth above 15 meters.
The next example is even more dramatic. The YY pump manufacturer renowned for its manufacturing excellence and the product diversity (from water to oil and gas to nuclear industries) was disqualified because its nearest reference was beyond the 20% capacity range variation set by the RFQ specification.
Such top features as the product price, delivery time, service life, and O&M costs are combined in a single criterion predicting the lifecycle costs (LCC).
To explain how Time and Cost may be merged, let's start with a simple question - Is shorter delivery time a decisive advantage? The default answer is affirmative. In practice, it depends on the project schedule. Its analysis with the help of the Crenger framework has led to several unexpected observations.
Typically, only 10% of the order packages touch the critical path and have a drag value equal to one accordingly. It means that a one-week delay in the package delivery adds exactly 1 week to the project schedule. Surprisingly, another 5% of the packages not touching the critical path have the same drag value: they are quasi-critical. Another 10% have the drags within 0.1 – 0.9. The remainder is indifferent to the most probable delivery time variance. It means that the default answer is wrong in 75% of cases, and penalties for the late delivery shall be selective.
It seems straightforward to convert the delay into the loss of production and revenues. This approach does not work, instead, a fixed percentage of penalties is used.
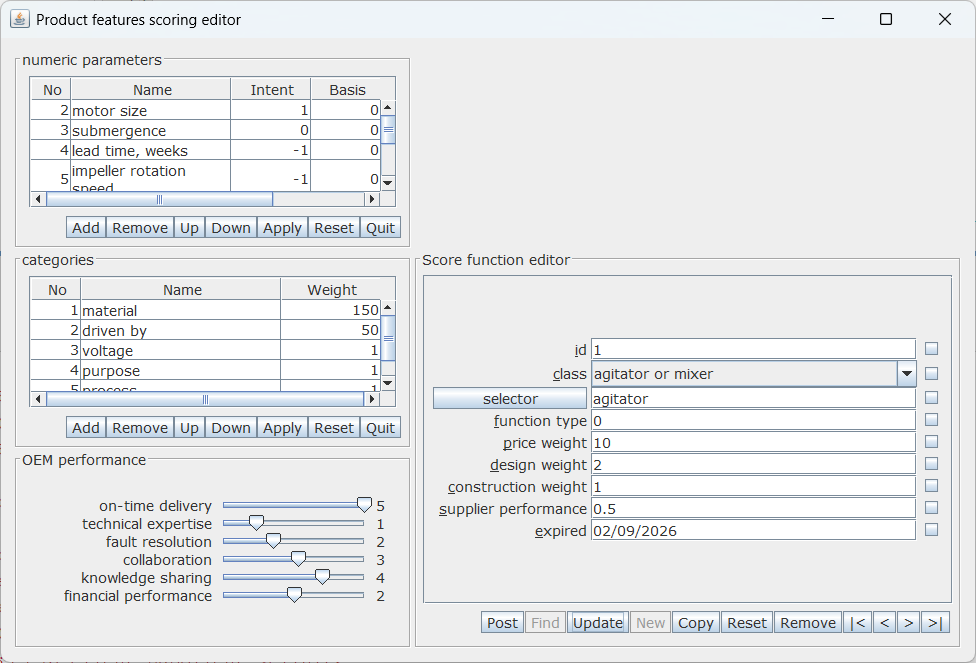
The next step in the quotes comparison is scoring quantitative and qualitative attributes of the product, collected in its specification. Scoring is based on the expert's assessment of the attribute's importance, using the following interface.
Comparing quantitative attributes is trickier as it shall take into account the attribute value accuracy and the deviation direction. For instance, the pump rotation speeds of 2980 rpm and 2985 rpm are the same, and the lower the speed the better.
Scoring different types of warranties and durations requires the expert's input as well. Extended warranties are a sign of confidence and trust.
Attachments and drawings are not excluded from comparison; they show how elaborate and well-crafted the offer is.
The OEM's previous sales, available local services, and sharable spare parts stocks boost the OEM rating.
The balance of comparison includes the OEM references strength score, the survey score, and the OEM poll rating.