

The impact of the plant electrical wiring design (EWD) on the desalination megaproject success is often underestimated by project managers as EWD is hidden behind the process and mechanical engineering. At the same time, it bears the brunt of all design and scope changes aggravated by the widespread practice of EWD outsourcing. The EWD budget and time overruns of 100-500% are not rare in megaprojects. In absolute terms, for a project of 250 MLD EWD requires over 25,000 man-hours and a budget of about US$ 4 million.
Can this risk source be eliminated? Below is an overview of the EWD automation framework developed by crenger.com.
EWD is a network of power consumers, power distribution systems, instruments connected to control systems, and electrical cables linking the abovementioned network elements.
In desalination mega-plants the major power consumers are AC motors and VFDs of the pumps feeding the reverse osmosis membranes with seawater. Power distribution includes motor control centers (MCC), power boards and panels, and switchgear. Elements of a control system are junction and terminal boxes, remote IO drops, PLC cabinets, and the UPS system.
The primary tasks of the electrical wiring design (EWD) include the following.
- positioning of network elements on the plant layout
- cableways routing
- network elements sizing and configuring
- electrical one-line diagram design
- cables sizing
This means that all the tasks are handled manually during the RFQ preparation. This practice adds thousands of man-hours to the project schedule. Besides, it is error-prone due to try-and-error iterations (on the positioning and routing of the elements), which always leads to scope creep.
This challenge triggered the development of an AI-driven framework for automated EWD. Being an integral part of the PlantDesigner software, it is granted direct access to all the plant data: P&IDs, layout, technical specifications, and electrical equipment catalogs. Auto-EWD includes several steps.
1. Mapping P&ID items to a plant plot
The plant plot is an output of a previously auto-generated plant design. It is described in "Plant Layout Design Automation".
To execute mapping, the user opens the layout window and a P&ID with items auto-selected for mapping. Upon clicking on the item the user clicks on the plant layout. Mapping is boosted with auto-positioning and copy-paste techniques. Copy-paste is applied to recurrent item patterns - identical equipment pieces or systems installed in parallel. Auto-positioning is a deduction of the item's location based on its ownership. For instance, all the pump's instruments may be positioned implicitly if the pump is already mapped. The P&ID item mapper interface is shown below.
2. Dividing the plant plot into "control" and "power" areas
The control wiring and power wiring areas contain P&ID items to be wired to PLC/DCS and MCC accordingly. To group the items, the user selects the polygon area on the plant layout. All the items inside the polygon will be wired to PLC and MCC automatically. The switchgear serves all the control and power wiring areas. Normally, control and power areas coincide and have reserved names in desalination mega-plants - intake station, pretreatment, SWRO, BWRO, and post-treatment.
3. Starting network design
To initiate this action the user opens the wiring editor and clicks the "wiring" menu.
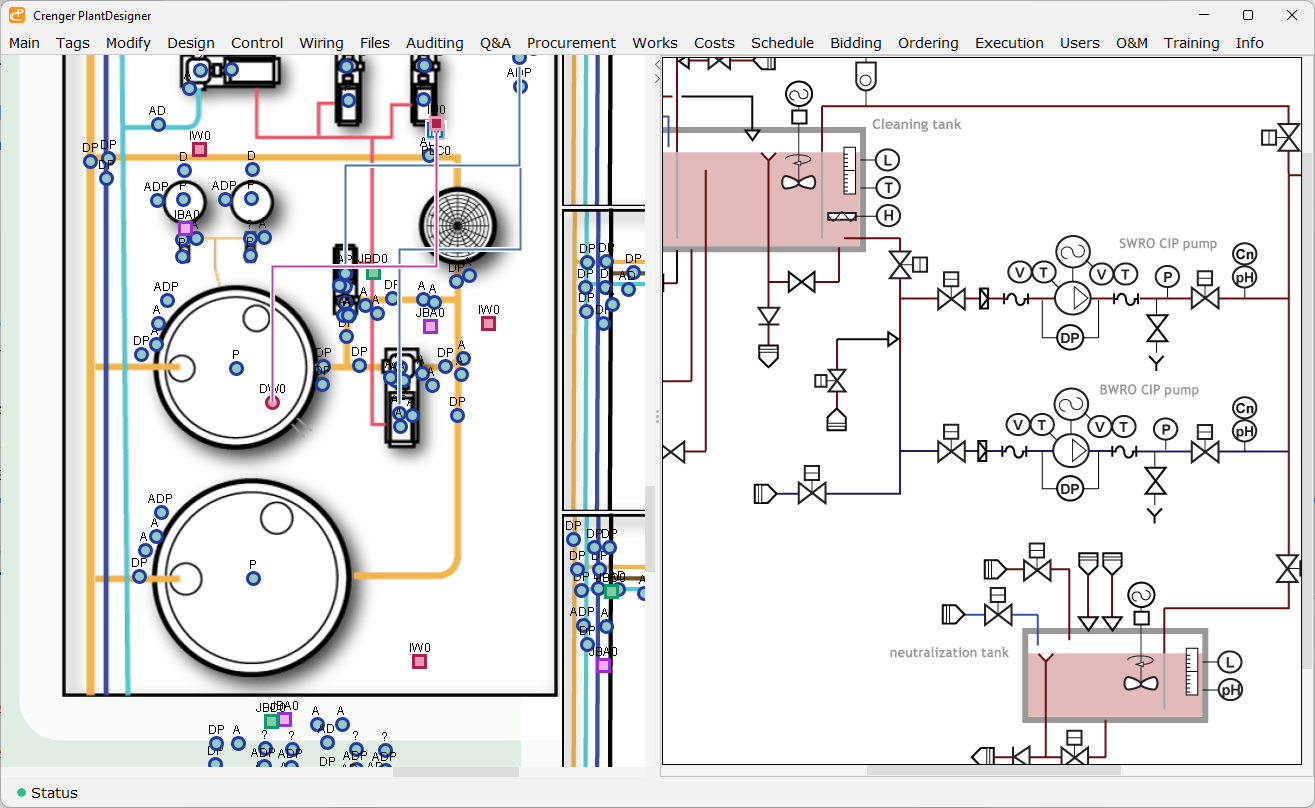
First, crenger.com auto-selects the locations of instrumentation junction boxes (analog, digital), remote drops, control cabinets with PLCs, terminal boxes and power distribution panels, MCCs, and switchgear. After an electrical layout, it links instruments and power consumers to the terminals mentioned above. If a different voltage is used an additional MCC type is silently added. The complete wiring design state is shown below.

After creneger.com defines the wiring network hierarchy and the cableway routing it starts the network elements and cables auto-sizing from transformers to circuit breakers, to cable glands and terminal strips of the junction boxes.
Based on the network hierarchy, crenger.com creates the electrical one-line diagram. It is responsive – it may be navigated and edited. Every element of the diagram (shown below) is linked to its full specification retrieved by a mouse click. Similarly, the control "one-line" diagram explaining the control system architecture is auto-generated.

Crenger.com proceeds to the automated PLC design. It selects the PLC racks, and the IO modules, and allocates the IO channels (with signal physical addresses) to the field instruments. Then it generates instrument wiring diagrams. The Crenger I/O viewer allows the I/O modules and racks to be navigated and updated.

Finally, It creates the Bill of Quantities (BOQ), the purchase order packs (for network elements and cables), the wiring metrics, and commissioning checklists. All the data on MCC and transformers may be viewed as specification datasheets.
The abovementioned wealth of information is created without a single user instruction.
How it works
The network elements' positioning and cable routing are a classic clustering problem related to unsupervised learning, with K-means being the algorithm of choice.
K-means clustering aims to partition n elements - mapped to the plant layout equipment pieces - into k clusters in which each element belongs to the cluster with the nearest mean (cluster centers or cluster centroid), serving as a prototype of the cluster. In our case, the cluster centroid is a wiring terminal - junction box, RIO drop, MCC, etc. The algorithm minimizes within-cluster variances - the total length of the cableway.
The next problem is how to loop through all RIO drops and/or PLC cabinets with one communication cable - a reliable control system design requirement. It is a typical traveling salesman problem (TSP).
TSP asks the following question: "Given a list of cities and the distances between each pair of cities, what is the shortest possible route that visits each city exactly once and returns to the origin city?"
As in our case, the number of network elements is rather small, so any approximate algorithm suffices.